IHS recently updated its Housing Market Indicators data portal with the newest data! Users can now view 2023 data on property sales, levels of business buyer activity, mortgage lending, foreclosure filings and more for Chicago community areas, wards, and regional counties and municipalities. We also updated key demographic and socioeconomic data including information on age of the population, race and ethnic composition, poverty status, and household income, tenure, and housing cost-burden.
These data are available for Chicago community areas, regional counties, and local municipalities. Data can be viewed as sortable tables and are also embedded as part of each area’s community profile. Some indicators can also be viewed as trendlines and maps.
Background on the Housing Market Indicators Data Portal
The data portal was created to provide Chicago housing and community development practitioners, policymakers, and community-based organizations with customizable data and information on communities they work in. Data on the portal summarize key indicators used as part the technical assistance and analyses IHS regularly provides to local partners.
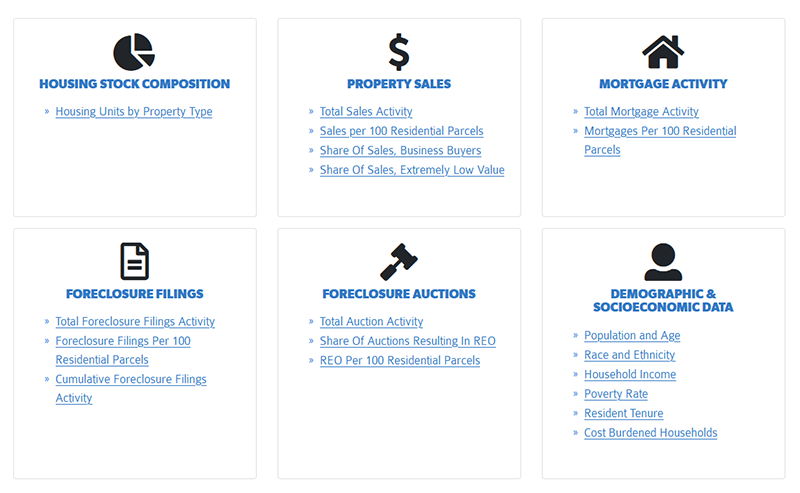
What data are available? Users can search for 13 housing market indicators and six demographic and socioeconomic indicators.
- Housing market indicators include data on housing stock composition, characteristics of property sales, mortgage lending activity, foreclosure filings, and completed foreclosure auction activity.
- Demographic and socioeconomic indicators include data on population, age, race and ethnicity, and household income, tenure, and housing cost-burden.
How are the data shown? Housing market and demographic and socioeconomic indicators can be viewed as tables, charts, interactive maps, and community profiles.
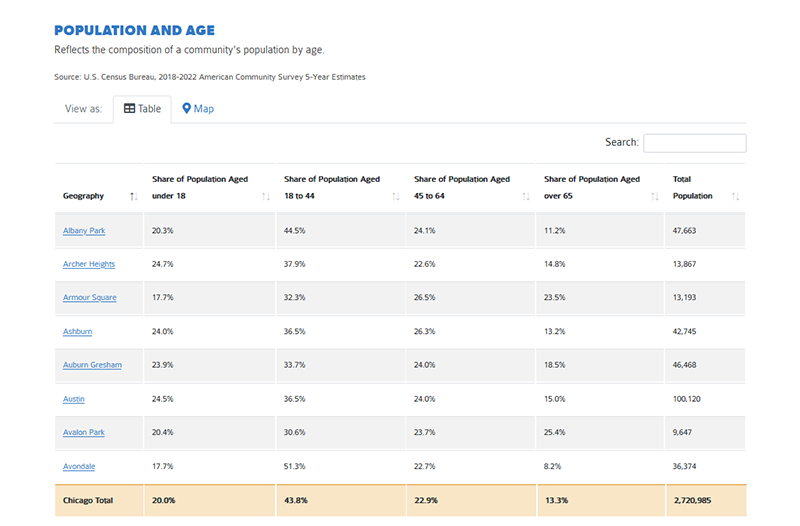
- Tables allow the user to view different geographies compared to the City of Chicago total.
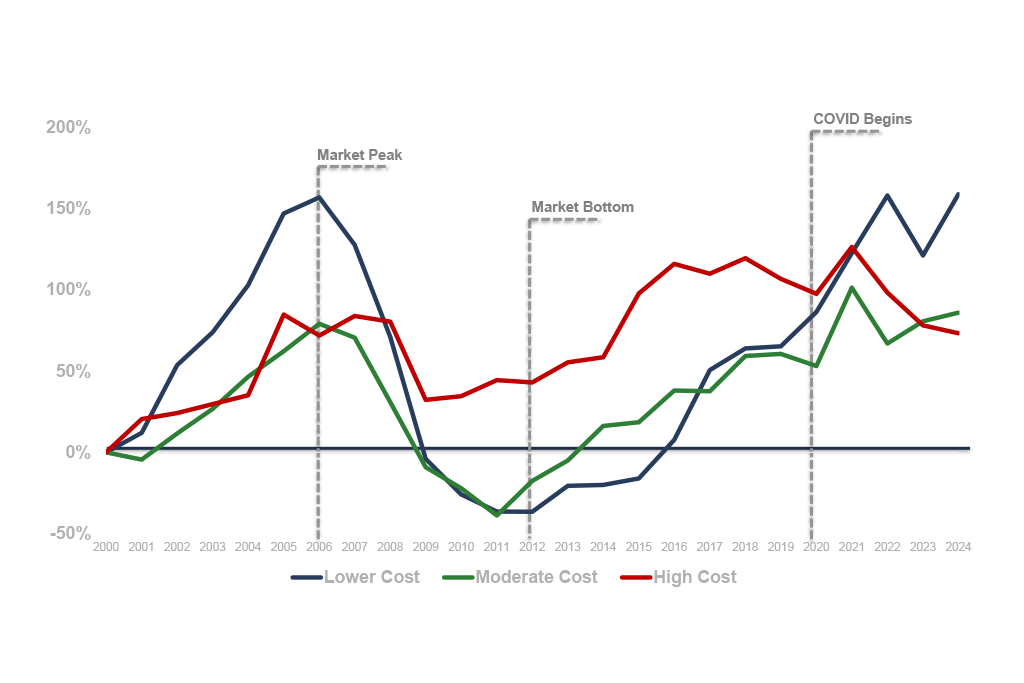
- Trends-lines visualize how certain indicators have changed throughout time and include highs, lows, and averages for each geography.
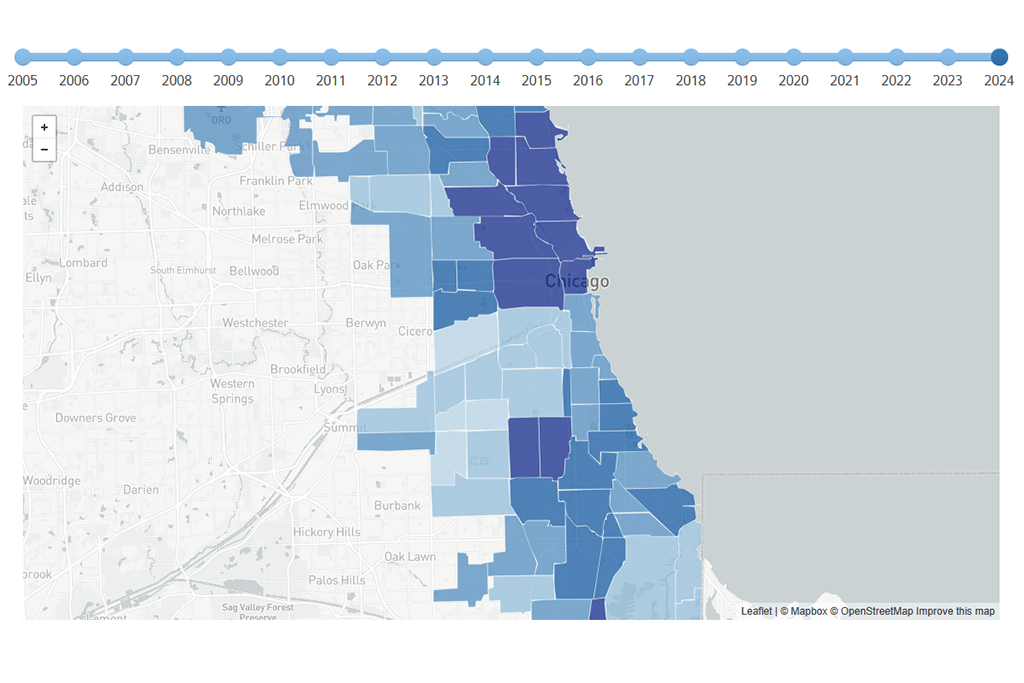
- Interactive maps allow the user to identify spatial concentrations and patterns.
- Community profiles provide a comprehensive report of all indicators for available geographies in the form of tables, charts, and maps.
Not sure what the data show? We’ve included data descriptions that summarize how to interpret the indicator and its importance. To learn more about how you can apply these data to your work, contact IHS Deputy Director Sarah Duda by email at sduda1@depaul.edu.