This is the first release of the IHS Cook County House Price Index and reflects house price changes on properties with repeat sales from the first quarter of 1997 through the second quarter of 2012. The IHS Cook County House Price Index breaks out price trends separately for the four main residential property types found in Cook County: single family detached homes, condominium units, small multifamily rental buildings with two-to-four units, and larger multifamily rental buildings with five or more units. The IHS Index allows users to compare price trends among these key segments of Cook County’s residential property market.
For a detailed description of the IHS Cook County House Price Index, click here. For each release of the Index, tabular data is available for download.
The Index illustrates the recent boom and bust cycle of the housing market and the effect that the foreclosure crisis has had on house prices in Cook County. Data through the second quarter show that among the four primary residential property types in Cook County, only larger multifamily properties have experienced any substantial recovery from recent price bottoms. Prices of single family homes, condominiums, and smaller multifamily properties remain at or near historically low levels since 2000 and have yet to experience sustained, consistent price increases.
Key Trends from Second Quarter 2012:
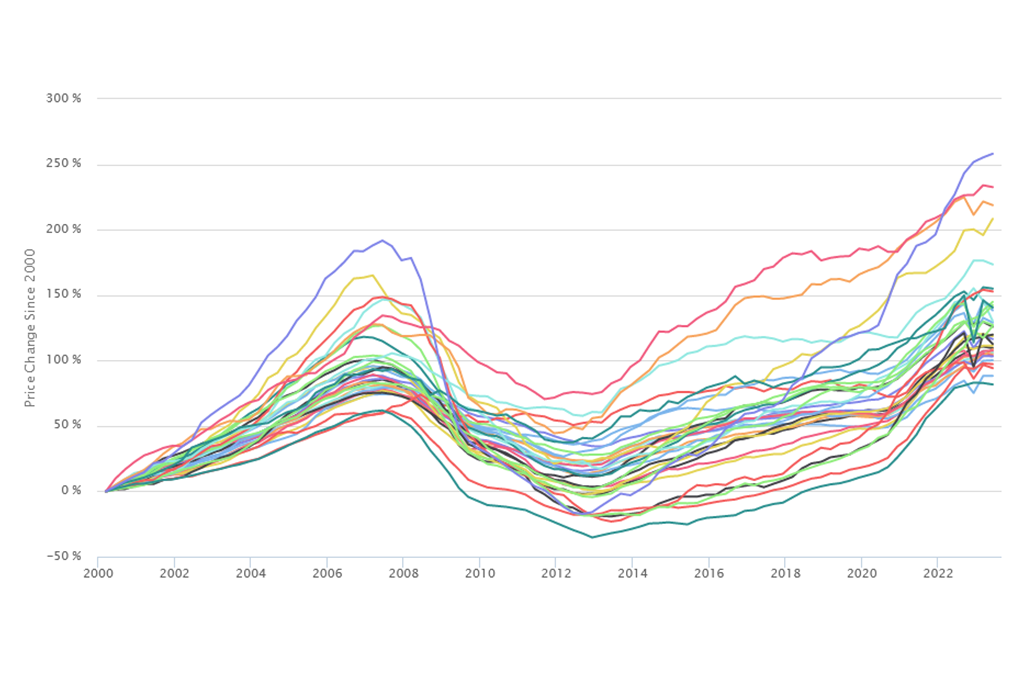
- The Cook County single family housing market has shown recent, modest signs of stability, but remains weak by historical standards. Figure 1 shows that Cook County’s single family housing market peaked in the fourth quarter of 2006 where prices were roughly 73 percent higher than prices in the first quarter of 2000. After reaching this peak, the single family market saw persistent price declines until it reached a bottom in the fourth quarter of 2011. From peak to bottom, single family home prices declined by 39 percent. Since the fourth quarter of 2011, the Cook County single family housing market has shown some signs of modest stability experiencing quarter-over-quarter price increases in the past two quarters. Between the first and second quarters of 2012, single family house prices increased by just over 3 percent. Year-over-year, however, prices still declined by just under three percent from the second quarter of 2011. Despite these signs of potential stability, single family house prices remain low by historical standards and have a long road to recovery. As of the second quarter 2012, single family house prices in Cook County were at a level similar to that seen in the second half of 2000, and, as illustrated by Figure 2, single family prices remain 37 percent off their peak levels. See Table 1 for more detailed Cook County data.
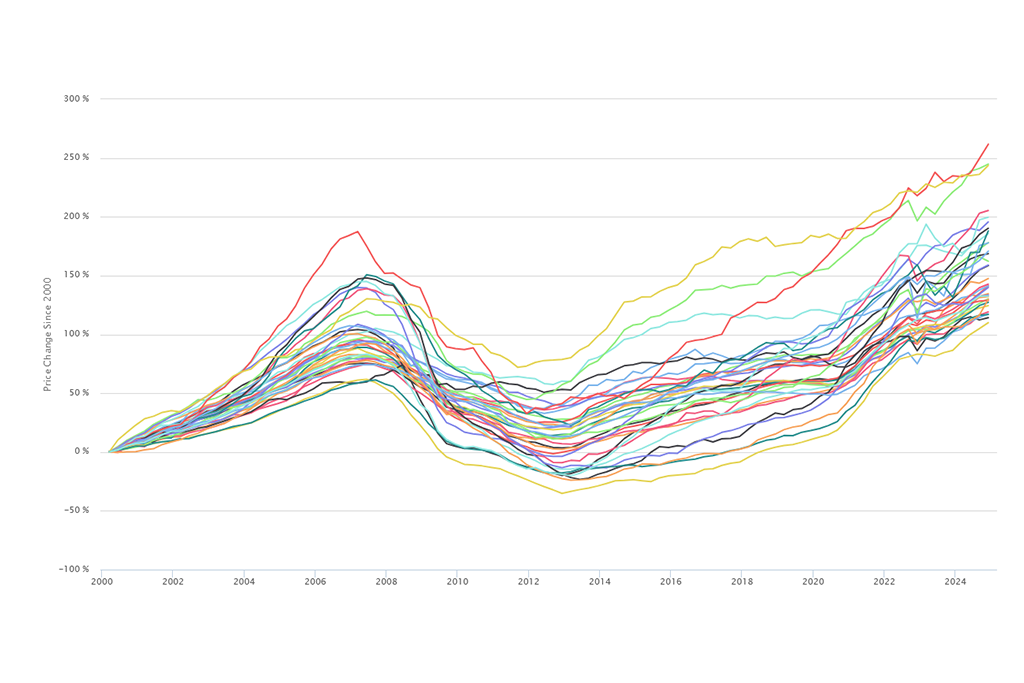
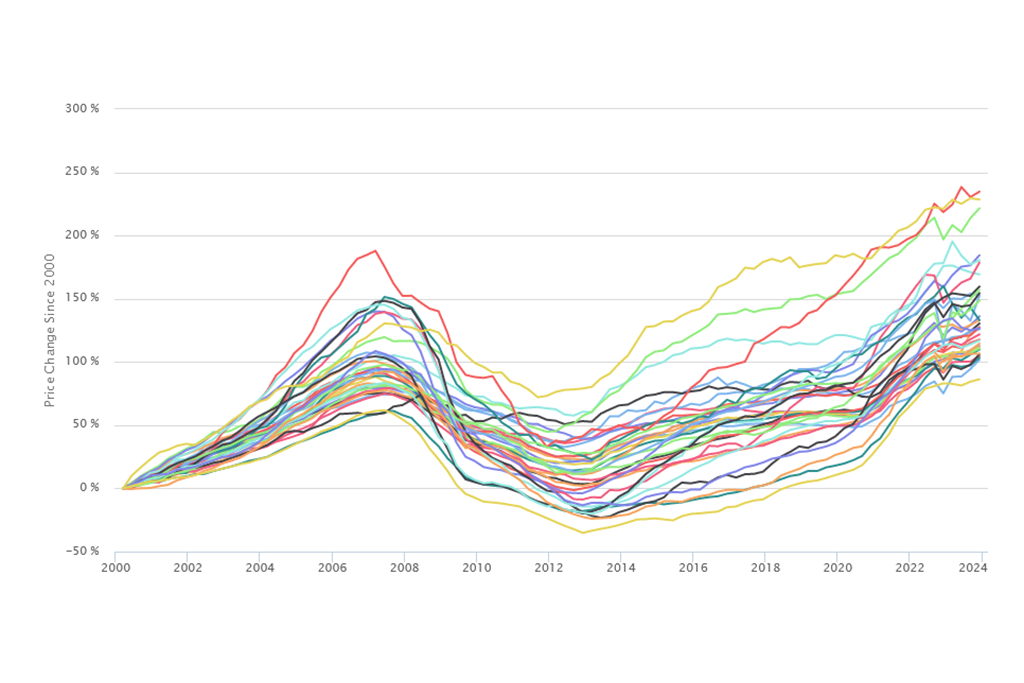
 Figure 1 - Cook County Price Changes by Property Type, 1997 to 2012 2Q
- The Cook County condominium market has seen persistent price declines and remains weak. Figure 1, shows that Cook County’s condominium market peaked in the first quarter of 2007 with price increases of nearly 61 percent from 2000. Of the four property types examined in the IHS Index, condominiums experienced the latest price peak. After reaching this peak, condominium prices saw persistent quarter-over-quarter price declines until reaching a low point in the first quarter of 2012. At this bottom, condominium prices were 52 percent less than they were in the first quarter of 2007. Although condominium prices saw their first quarter-over-quarter increase in roughly five years between the first and second quarters of 2012, condominium prices in Cook County declined by over 11 percent year-over-year from the second quarter of 2011. Figure 1 shows that of the four property types examined, condominiums are at the lowest price level relative to 2000. As of the second quarter of 2012, Cook County condominium prices were at pre-1997 levels. Figure 2 shows that condominium prices are 51 percent off their peak and have not experienced any real price recovery.
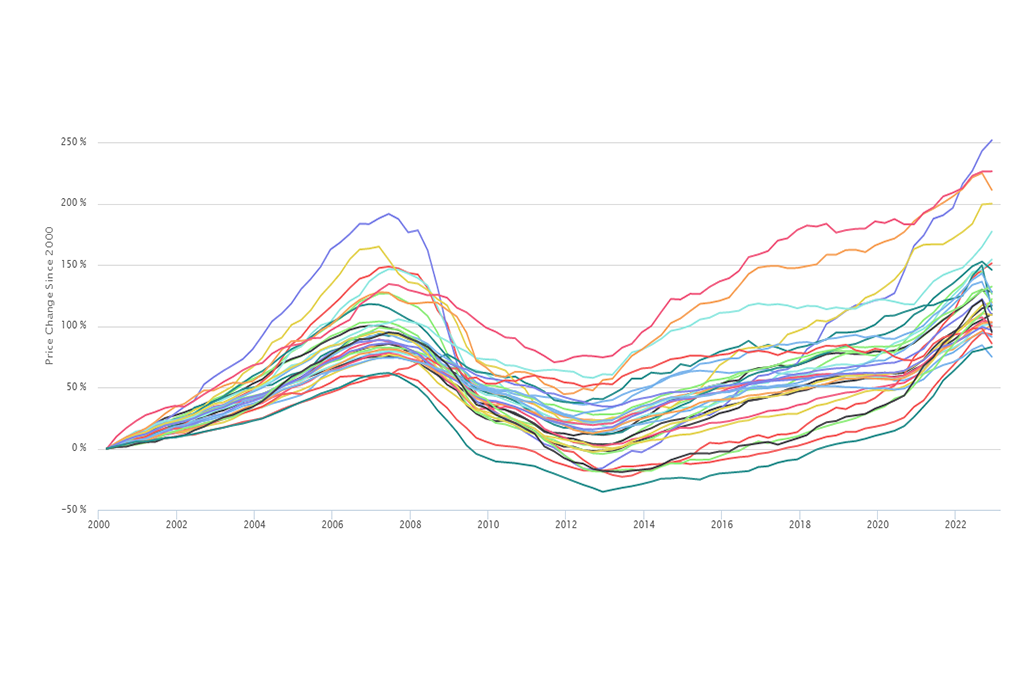
 Figure 2 - Cumulative Annual Price Changes by Property Type in Cook County, 1997 to 2012 2Q
- For much of the 2000's, the price trends of small and large multifamily properties were very similar. As illustrated by Figure 1, both larger and smaller multifamily rental buildings experienced similar boom and bust cycles with large price increases from 2000 to their respective peaks and subsequent dramatic price declines. Prices for larger multifamily buildings with more than five units saw prices peak in the third quarter of 2006, increasing by over 118 percent from 2000 prices. This was the largest price increase for any of the four primary residential property types in Cook County. After reaching this peak, prices for larger multifamily buildings declined by nearly 50 percent and reached bottom in the fourth quarter of 2010. At the same time, smaller multifamily buildings with two-to-four units peaked in the fourth quarter of 2006, increasing by over 111 percent from 2000 prices. After this peak, prices for small multifamily buildings fell dramatically by nearly 60 percent, also reaching bottom in the fourth quarter of 2010.
- Larger multifamily buildings have experienced a substantial price recovery since hitting their price bottom and are the only property type in Cook County that has seen a strong recent increases in price. After reaching bottom in the fourth quarter of 2010, price trends for both types of multifamily rental buildings diverged with larger multifamily rental buildings seeing strong recent price increases while the market for smaller multifamily rental buildings remains weak. Benefiting from a strong rental market, prices for larger multifamily properties have seen price increases in three consecutive quarters, and, between the second quarter of 2011 and the second quarter of 2012, prices for large multifamily buildings increased by over 30 percent. As illustrated in Figure 2, larger multifamily rental properties have seen the strongest price recovery of any property type. As of the second quarter 2012, larger multifamily buildings were roughly 26 percent below their 2006 peak after bottoming out at nearly 50 percent off peak. Smaller multifamily rental properties, on the other hand, have not benefited from the recent strength of the rental market. Smaller multifamily buildings reached bottom in the fourth quarter of 2010 and have not experienced any substantial price increases. As Figure 2 illustrates, prices for smaller multifamily buildings bottomed out at nearly 60 percent off their peak and as of the second quarter 2012 were still 55 percent below what they were at their peak. Figure 1 shows that these small multifamily buildings have remained at pre-2000 price levels since reaching bottom in 2010.
 Table 1 - Cook County Price Change Data by Property Type (Index values are based on a value of 100 in 2000 Q1)
Discussion:
Large multifamily buildings have benefited from the recent strength of the rental market, but small multifamily buildings have not. In part, this is because of specific challenges associated with two-to-four unit buildings. For example, a previous IHS Data Brief illustrated that the stock of two-to-four unit buildings has been heavily impacted by foreclosures and is largely concentrated in lower-income neighborhoods with weak demand for owner occupants. A recent IHS Research Report found that much of the activity in the two-to-four segment of the market is cash purchases of low-value, foreclosure-related distressed sales. Limited access to capital for potential investors in two-to-four unit properties adds to the challenge of returning buildings in this distressed segment of the market to productive use. Conversely, many of the larger multifamily buildings that have been part of recent transactions are higher value properties typically found in neighborhoods that have seen recent increases in rental demand such as areas around the Loop and along Lake Michigan. The strength of the rental market in these communities along with the limited supply of new multifamily construction has translated to price increases in the existing stock of larger multifamily buildings.
Despite recent signs of modest stability in the single family market, it is unclear whether the Cook County market has reached its ultimate bottom. Uncertainty surrounding the size of the “shadow inventory” of properties in the foreclosure pipeline and the timing of when those properties will hit the market will likely continue to affect Cook County house prices and has the potential to limit any substantial recovery in the near future.
Data Sources
To calculate the IHS Cook County House Price Index, the Institute uses data on property sales from the Cook County Recorder of Deeds (via Property Insight) and Midwest Real Estate Data. IHS also uses data from the Cook County Assessor's Office to determine property characteristics, price tiers, and the weighting of different types of property sales. For more information, click here.