The Third Quarter 2012 IHS Cook County House Price Index reflects house price changes on properties with repeat sales from the first quarter of 1997 through the third quarter of 2012. The IHS House Price Index tracks quarterly price changes for the four primary residential property types found in the County: single family homes, condominium units, small rental buildings with two-to-four units, and larger rental buildings with five or more units. The index also divides properties into low-, middle-, and high-value segments to track price changes for properties in different value tiers. Value segments are based on the average of the 2009 and 2010 assessed value of a property.
For a detailed description of the IHS Cook County House Price Index and how price tiers are calculated, click here. For each release of the Index, tabular data is available for download.
Data from the third quarter of 2012 show that, despite recent optimism that prices for single family homes and condominium units are recovering, these segments of the market continue to struggle. At the same time, the rental market continues to show positive signs. Prices for small rental properties remain low, but have experienced recent improvements driven largely by price increases in the low-value segment of the market. Prices for larger multifamily rental buildings continue to see year-over-year increases.
Key Trends from Third Quarter 2012:
Single family homes
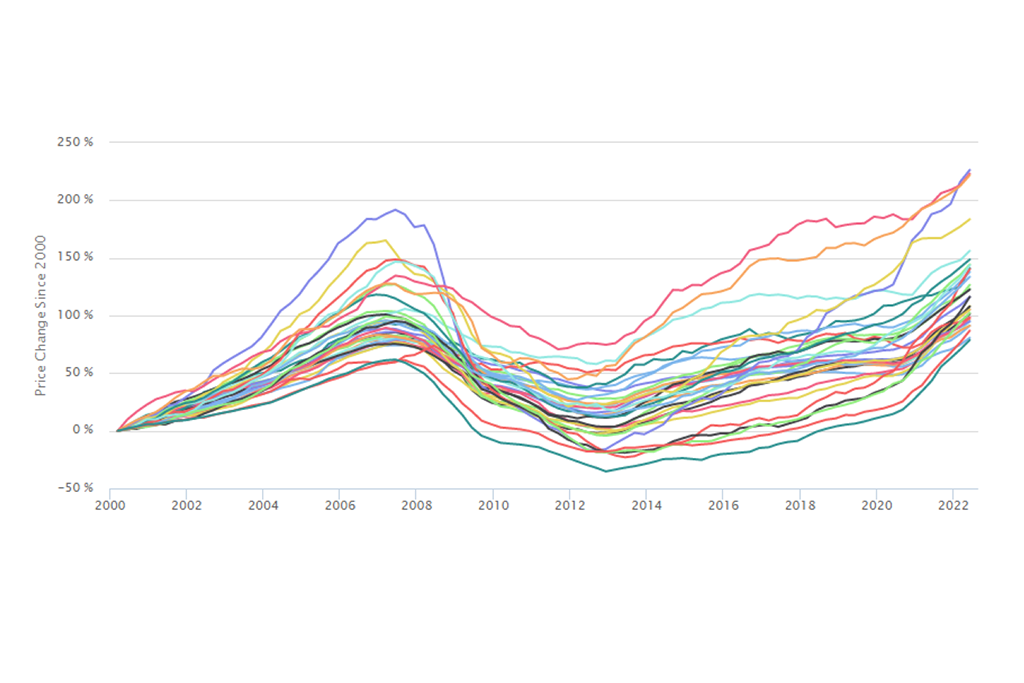
- The single family market remains weak. While nationally single family home prices have shown recent signs of stability and improvement, single family home prices in Cook County have yet to stabilize. Prices for single family homes were down nearly three percent year-over-year from the third quarter of 2011 (see Figure 1 for full price trend). After experiencing quarter-over-quarter price increases in the first and second quarters of 2012, single family homes saw a quarter-over-quarter price decline of one percent from the second to the third quarter. From their peak in 2007, single family home prices were down by over 38 percent as of the third quarter (see Figure 2).
 Figure 1 - Cook County Price Changes by Property Type, 1997 to Third Quarter 2012
- Breaking up the single family market into low-, middle-, and high-value segments shows that single family price declines have largely been driven by middle-value properties. Figure 3 shows that year-over-year, prices for middle-tier properties declined by nearly 10 percent. By comparison, low-value properties saw a two percent year-year-over-year decline, and high-value properties saw a slight price increase.
Condominiums
- Prices for condominium units once again decline. After halting 17 straight quarters of price declines in the second quarter of 2012, the condominium market in Cook County once again saw quarter-over-quarter declines in the third quarter of 2012 with prices declining by nearly one percent. Year-over-year, condominium prices are down nearly 12 percent from the third quarter of 2011. Condominium prices have seen no real price recovery and as of the third quarter 2012 were down by over 52 percent from their peak.
- Segmenting the condominium market into low-, middle-, and high-value segments shows that condo price declines are largely being driven by the lowest-value units. Despite recent price increases, low-value condos still saw year-over-year declines of over 11 percent in the third quarter. Middle-value condominium units experienced an even larger year-over-year decline of more than 13 percent. By comparison, the highest value condos saw a year-over-year declines of just less than two percent. See Figure 3 for year-over-year price changes by value tier.
Two-to-four unit small rental buildings
- Small rental building prices remain at low levels relative to their peak but have seen recent signs of improvement. After experiencing dramatic price declines following price peaks in 2006 and seeing no sustained price recovery after hitting bottom in 2010 at pre-2000 price levels, two-to-four unit, small rental buildings have seen two consecutive quarters of price increases. Between the second and third quarters of 2012, two-to-four unit buildings experienced a 10.5 percent price increase, and year-over-year, two-to-four unit buildings saw price increases of greater than 10 percent. As Figure 1 shows, prices for two-to-four unit buildings are at their highest point since the third quarter of 2009, but still remain at pre-2000 price levels. Figure 2 illustrates that, in the third quarter, prices of two-to-four unit buildings were down from their peak by more than 54 percent.
 Figure 2 - Cumulative Annual Price Changes by Property Type in Cook County, From Price Peak to Third Quarter 2012
- Recent price increases for small rental buildings have largely been a product of price increases in the lowest- and highest-value price tiers. For the lowest-value two-to-four unit buildings, prices increased by nearly 19 percent year-over-year. The highest-value two-to-four unit buildings saw year-over-year increases of over seven percent. Prices for the lowest-value small rental buildings are likely benefiting from increased competition among investors for low-cost distressed sales, while higher-value buildings are benefiting from increased rental housing demand in neighborhoods with more stable, stronger real estate markets. See Figure 3 for year-over-year changes by value tier.
- Two-to-four unit properties are a major part of the Cook County rental housing stock and particularly important to the County’s supply of affordable rental housing. They account for over 26 percent of the housing units in the City of Chicago. In Cook County’s low- and moderate-income communities, two-to-four unit buildings account for more than 53 percent of all multifamily rental units.
 Figure 3 - Year-over-year Price Changes by Value Tier and Property Type, Third Quarter 2011 to Third Quarter 2012
Five-or-more unit large rental buildings
- Larger multifamily properties saw price declines but remain the strongest segment of the residential market. Larger multifamily properties continue to benefit from strong rental demand and the limited new supply of rental housing. Although larger multifamily buildings saw a nine percent quarter-over-quarter price decline between the second and third quarters of 2012, these buildings still saw year-over-year price increases of over 14 percent. Of all major residential property types, they have seen the strongest price recovery. Prices for larger multifamily rental properties are 34 percent below their peak. This is up from a bottom of nearly 49 percent less than their peak prices.
Data Sources
To calculate the IHS Cook County House Price Index, the Institute uses data on property sales from the Cook County Recorder of Deeds (via Property Insight) and Midwest Real Estate Data. IHS also uses data from the Cook County Assessor's Office to determine property characteristics, price tiers, and the weighting of different types of property sales. For more information, click here.