As the United States limps out of economic disarray, it can often seem like the nation is taking one step forward and two back. This spring’s home-buying season is typical of that lurching sensation.
Home prices are slowly climbing—by 4.6 percent since last year, according to Black Knight Financial Services. The latest report from the National Association of Realtors has the median existing-home price for all housing types in March at $212,100. That is 7.8 percent above March of last year and the highest in 18 months.
With the economy in recovery, potential homebuyers are likelier to have jobs and disposable income. Gallup reports that Americans are more optimistic about the housing market than they were during periods of record lows from 2006 to 2008. However, fewer of those polled—69 percent—think now is a good time to buy a home when compared to 73 percent and 74 percent in the two prior years. There is still trepidation.
Potential first-time homebuyers might only get as far as window shopping this spring. The portion of buyers who had not previously owned a home remained stagnant, at 30 percent, from March 2014 to March 2015. They are not easing into the market like veteran homeowners. Younger people are particularly leery of making the leap. In 2014, 16 percent of young adults were homeowners, a major drop from the peak of 22 percent in 2005. Often shouldering student loans, many are living with their parents instead of renting apartments—let alone buying a house. There is also evidence that this latest generation of young adults is more skeptical of the value of homeownership.
Equity is steadily increasing, which should be good news for homeowners. But as the Urban Institute explains, one indicator of a healthy housing market is when rises in mortgage debt correlate with rising house appreciations. That has not happened in all markets yet. Writing for the institute, Karan Kaul and Taz George say: “The recent increase in house prices without corresponding increases in homeownership and mortgage debt is not only a sign that housing markets are far from healthy, but is another reminder of how tight today’s lending standards are.”
While equity is on the rise nationally, some markets are still in trouble. According to a report from RealtyTrac, 29 percent of mortgaged residential properties in Lakeland, Florida, are “seriously” underwater; the properties are worth at least one-fourth less than the loans owed by the homeowners. Las Vegas, and Akron and Cleveland in Ohio, follow closely behind. Because the owners lack the equity to sell, many properties are off the market, and may be for years. A recent Zillow report notes that homes that are seriously underwater may be stuck for more than 10 years if home values stick to projected 3 percent annual increases.
These metro markets’ positions remind us that all real estate is local. National numbers can only tell us so much about individuals’ and communities’ realities. Trends differ across states, counties, and within communities. Despite the overall rise in housing prices, even major metro areas are in wildly different places along their journeys to recovery. The Urban Institute, for example, finds that the New York/New Jersey metro area needs to climb only 1.6 percent to reach its peak housing prices, whereas the Phoenix area is 40.8 percent behind its peak.
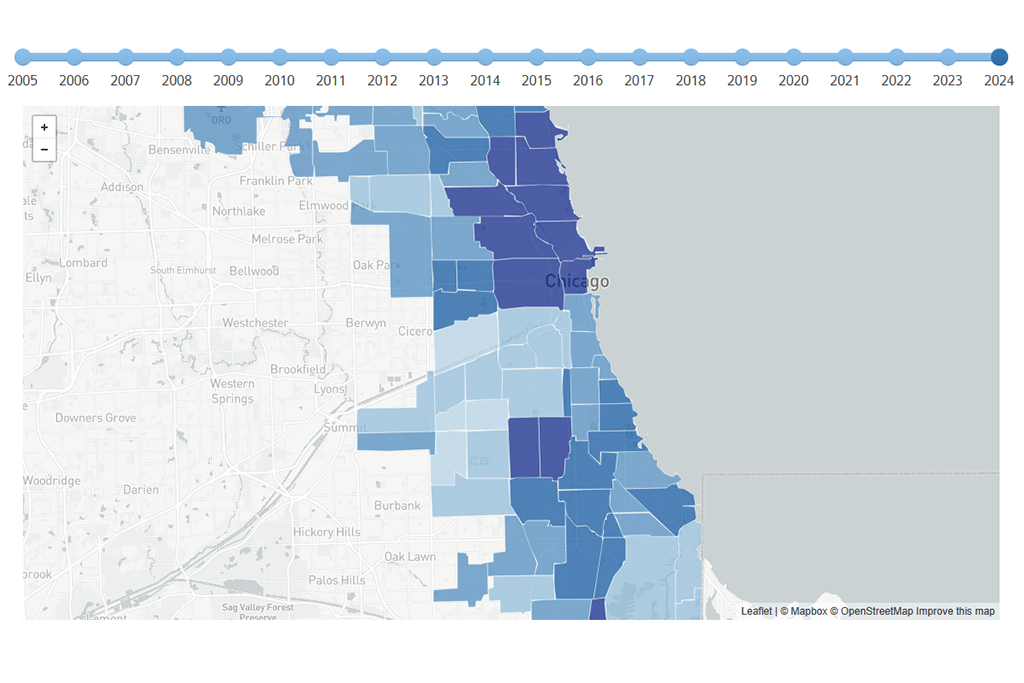
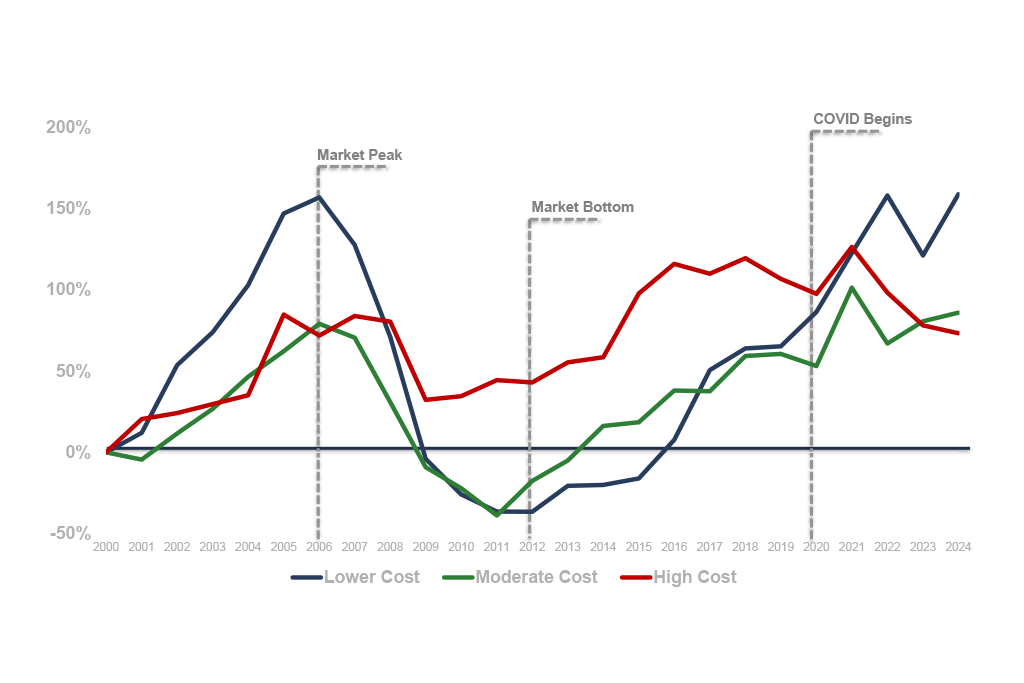
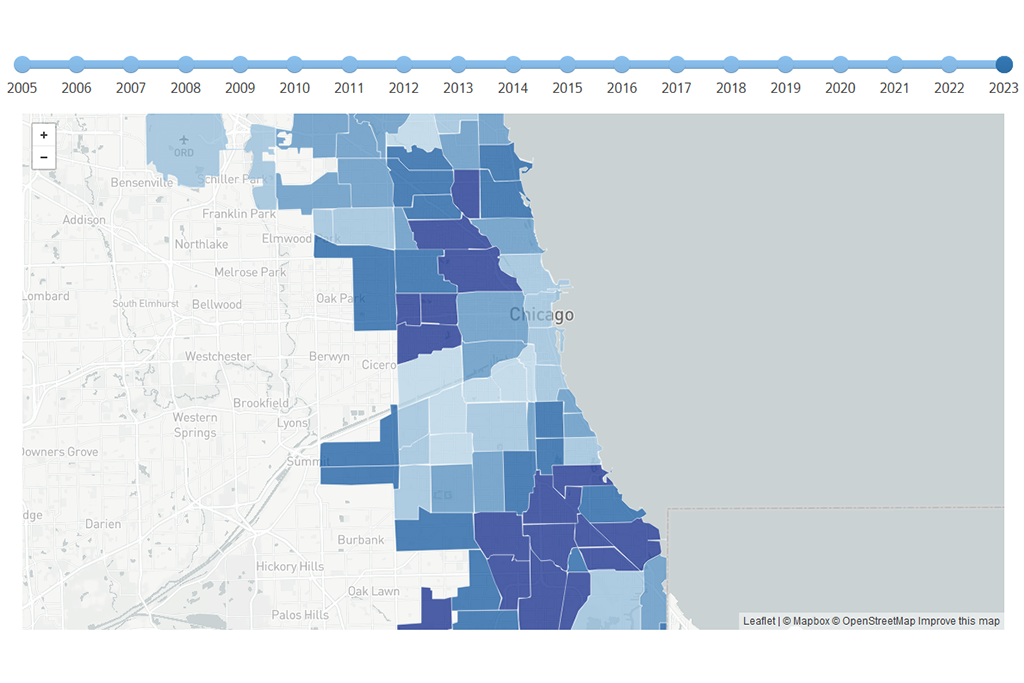
In the Chicago area—home to one of the most underwater markets—prices must rise 32 percent to reach their peak, and within the city, prices, demand, and recovery vary from neighborhood to neighborhood. To understand how local circumstances compare to one another, and to national numbers, we conducted comprehensive research on housing trends in the Chicago metro area. Price patterns throughout the region can help predict future economic conditions, and disparities between neighborhoods illustrate larger issues of socioeconomic inequality. In a new report coming this Wednesday and in upcoming blog posts, we will break down the numbers and provide a detailed look at housing patterns in Chicago.
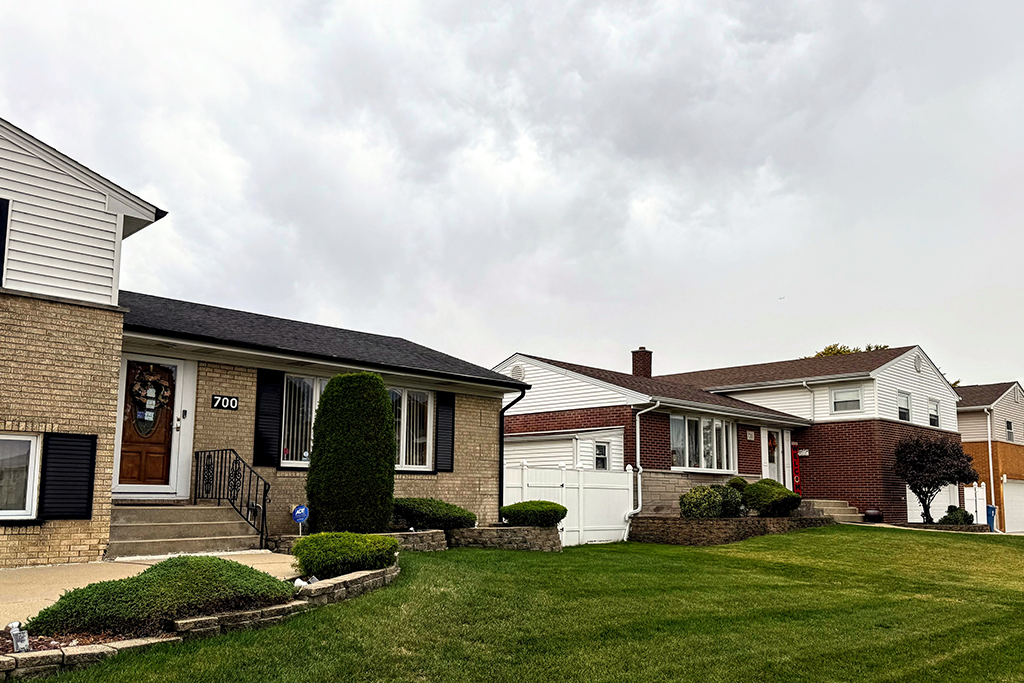
Photo/Stephen M. Scott