In 1625, a Dutch carpenter named Pieter Fransz built a house in Amsterdam’s new Herengracht neighborhood. “As the Dutch Republic rose to global power in the 1620s,” wrote Prakash Loungani for the International Monetary Fund, “the price of the house doubled in less than a decade. Over the succeeding three centuries, the price of Fransz’s house was knocked down by wars, recessions, and financial crises, and rose again in their aftermaths. When the house changed hands in the 1980s, its real value, that is after inflation, had only doubled over the course of 350 years, offering a very modest rate of return on the investment.”
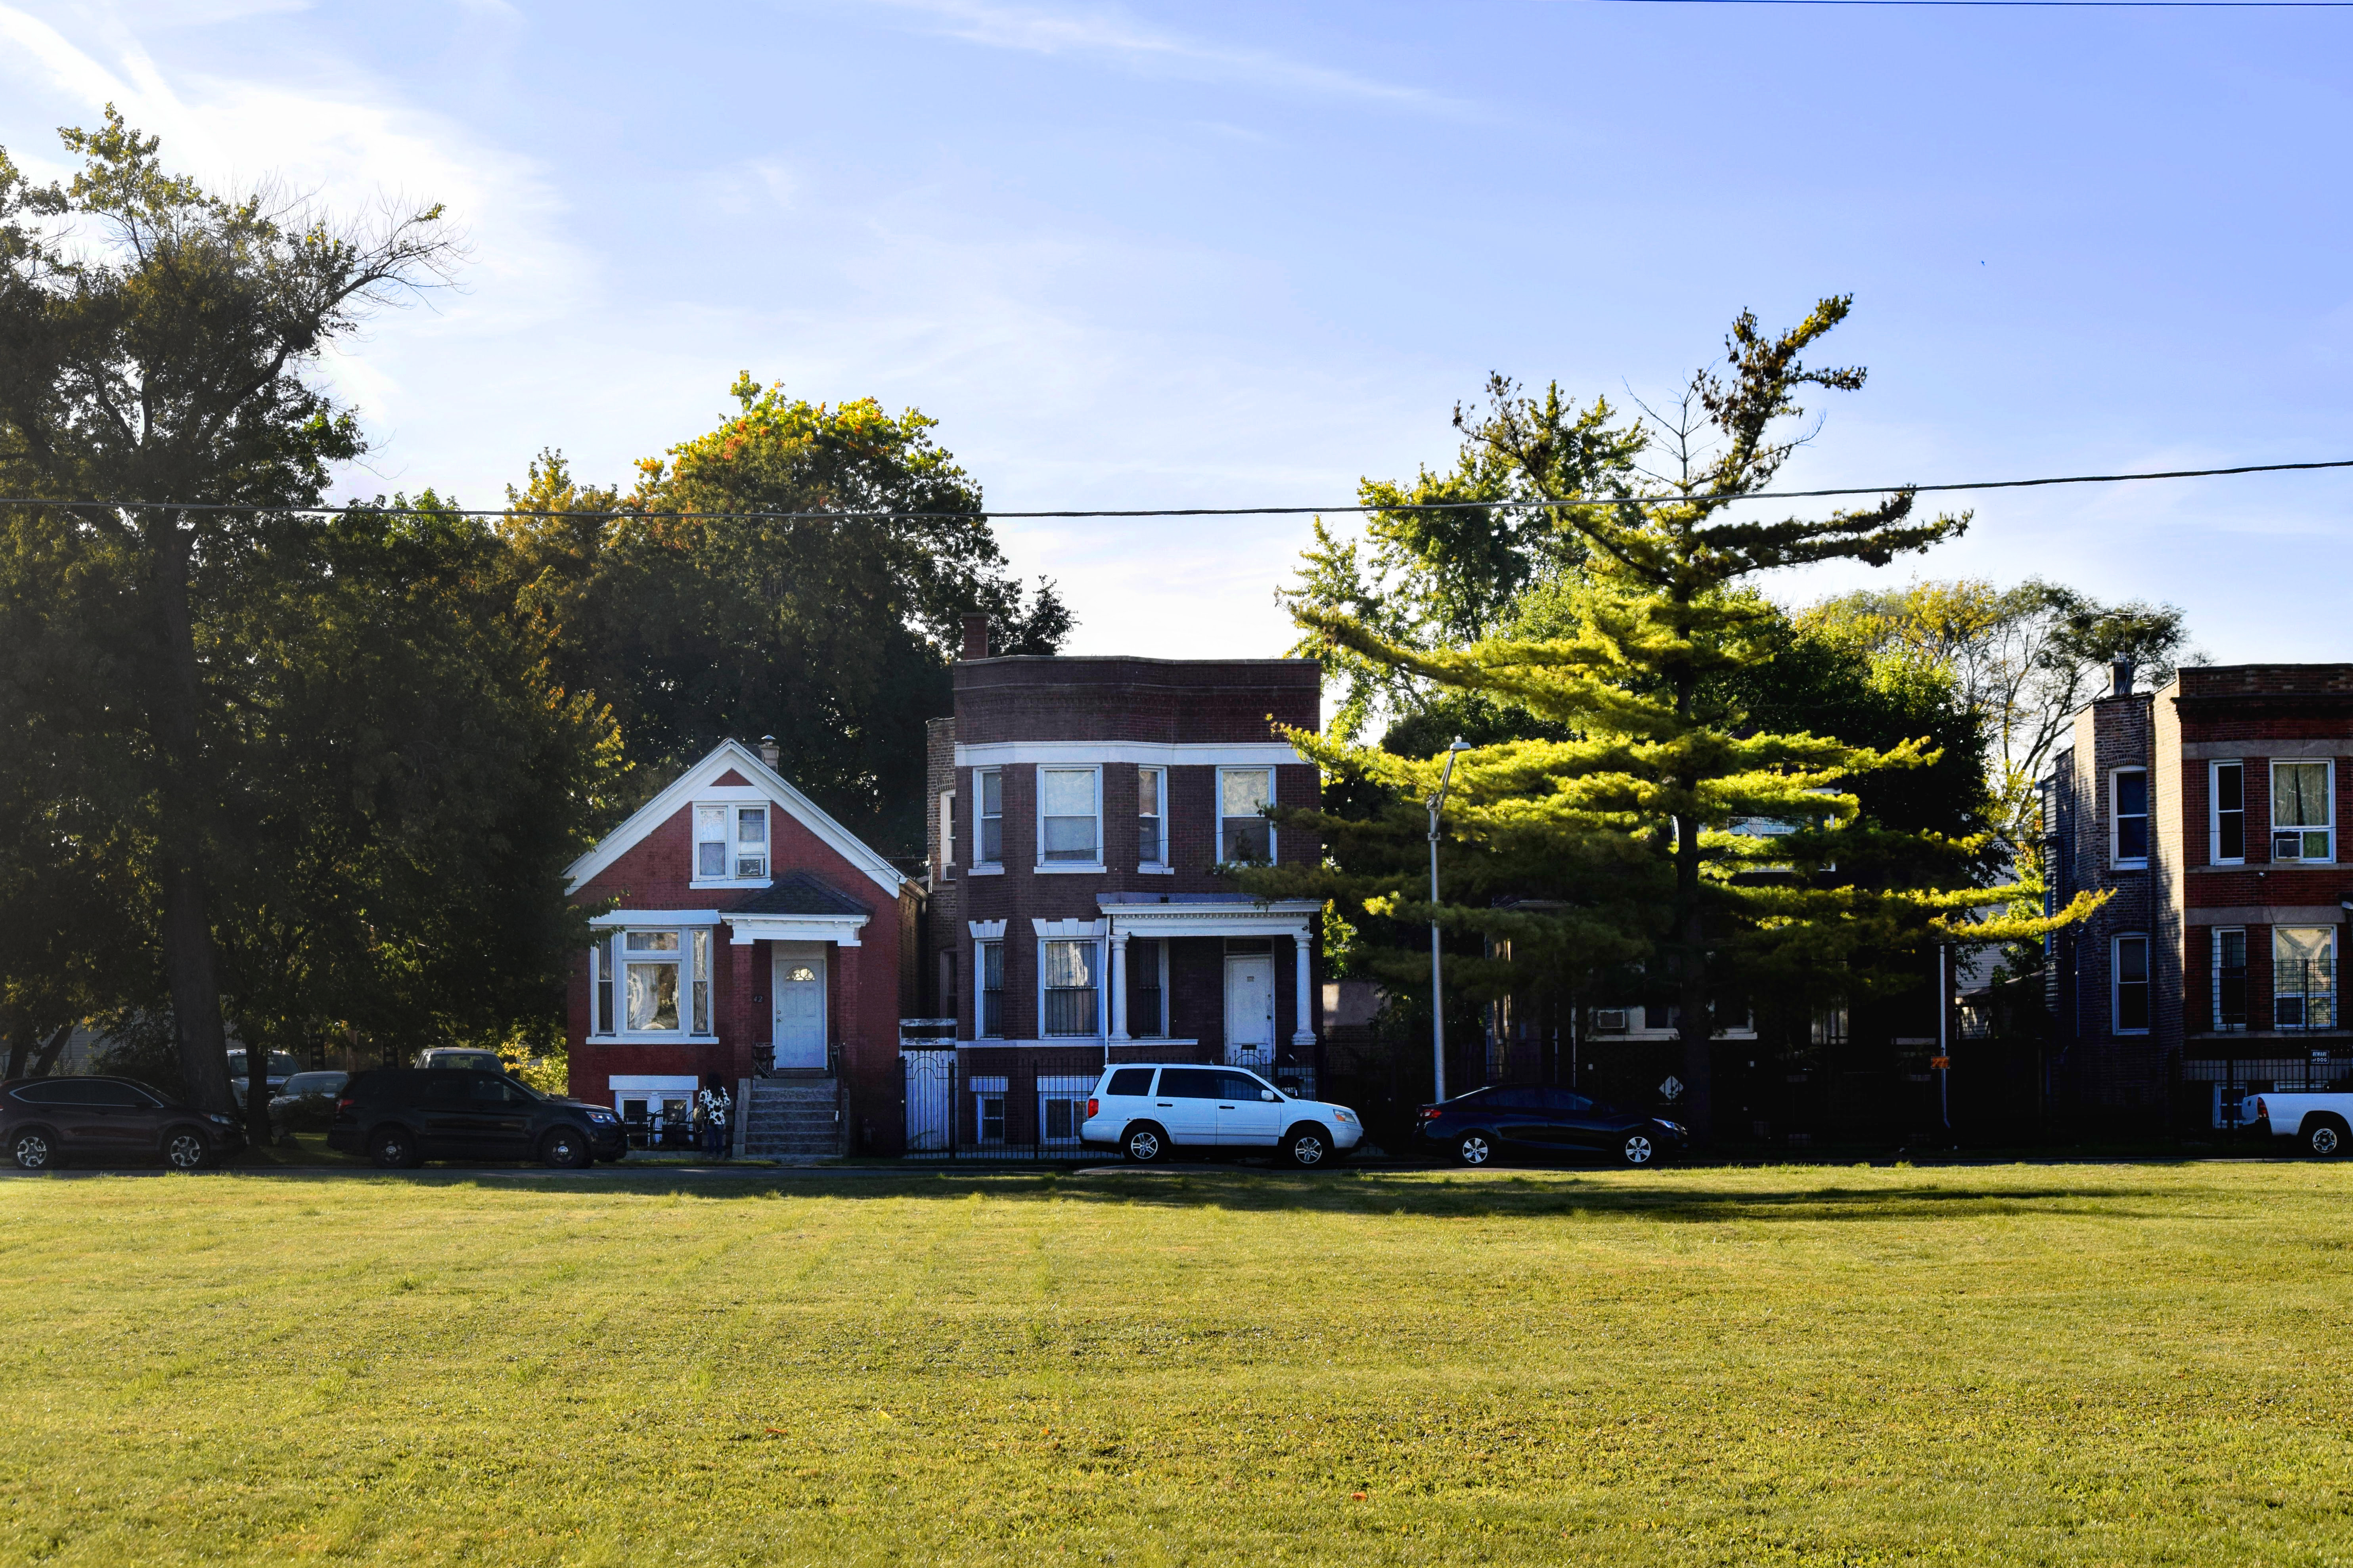
People in neighborhoods like Humboldt Park in Chicago might want to remember this long view, because the recent past has been a wild ride.
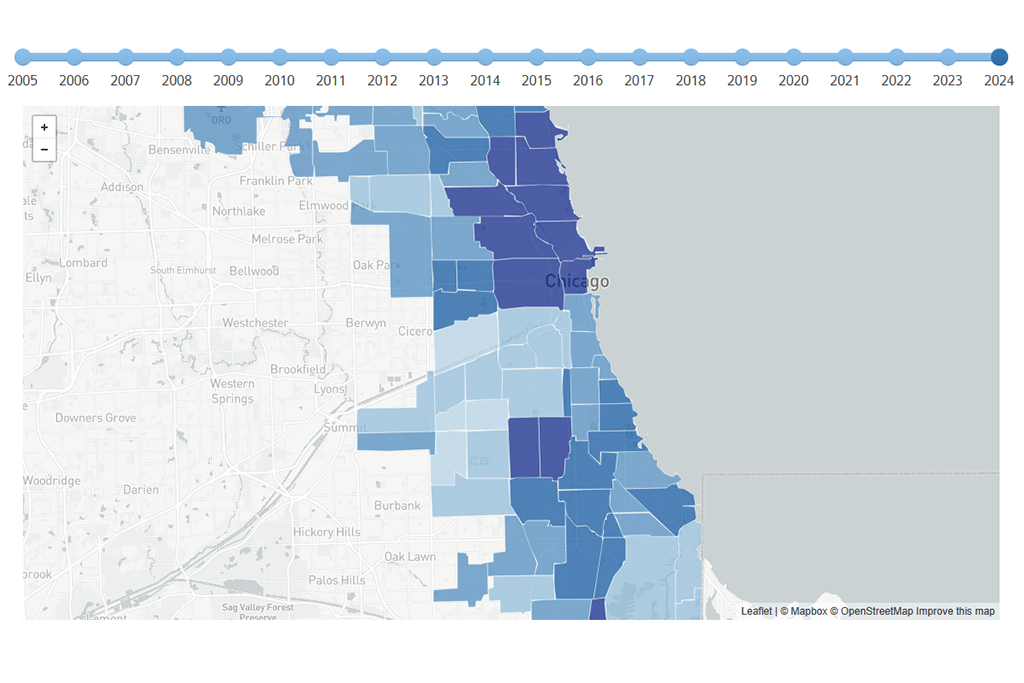
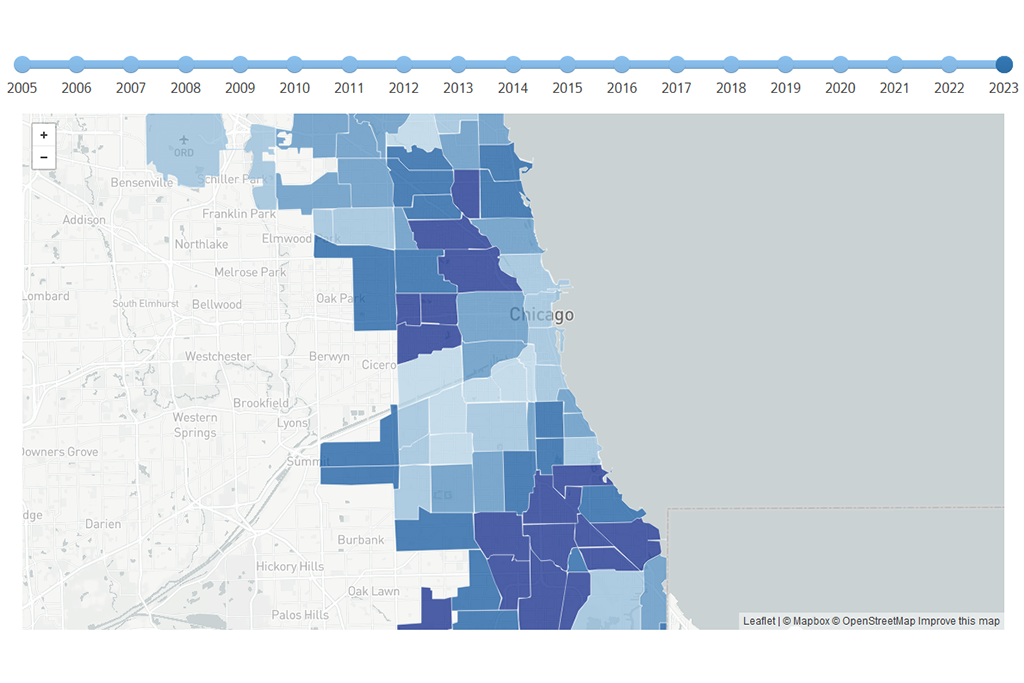
Our recently released Cook County House Price Index includes a measurement of 33 submarkets’ “recovery from the bottom.” The metric measures the change in price level of a submarket’s lowest point from the housing collapse (2008) through the fourth quarter of 2014. Peak to trough was calculated by using data from the price index as well.
In 2014, the real estate platform Redfin named Humboldt Park one of the hottest markets in the nation. Curbed Chicago agreed, noting that Humboldt Park was benefiting from the gentrification of neighboring West Town and Logan Square. That is quite a turnaround since 2005, when Humboldt Park was hit hard by foreclosures, with 25 percent or more of its housing stock in foreclosure between 2005 and 2012.
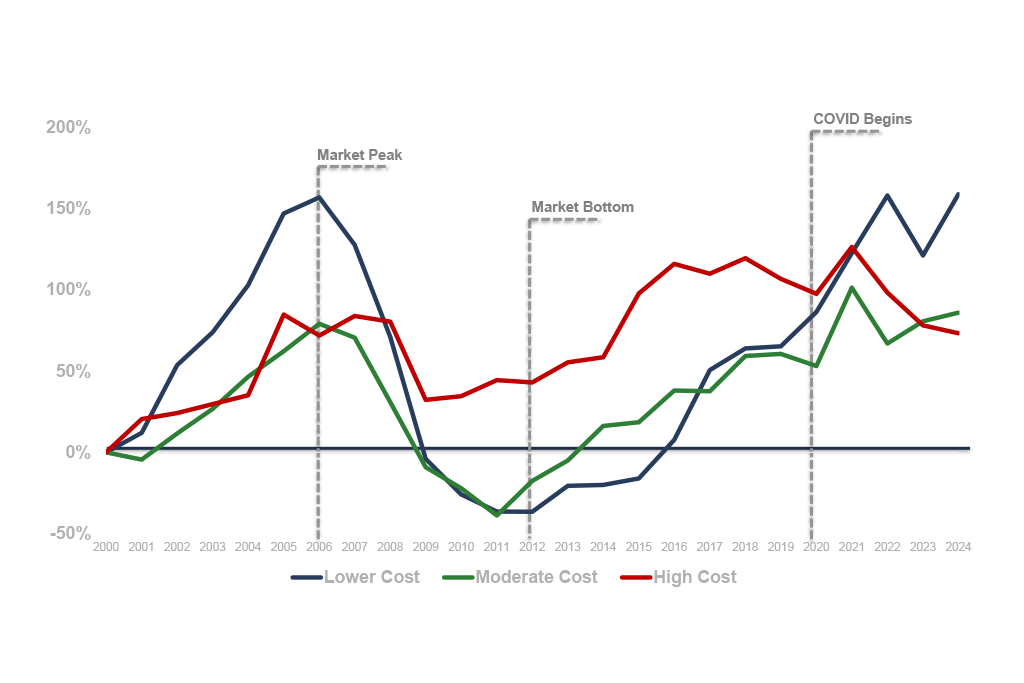
As we've previously noted, the city and suburbs have been rebounding steadily since the bottom of the market. But as we have found in our other measurements, a rising tide is not lifting all boats equally. While every neighborhood in Chicago has risen from rock bottom, price rebounds range from 6 percent to more than 40 percent.
For example, prices of single-family homes in Logan Square and Avondale are 42.3 percent above their lowest points. The city submarkets’ median recovery from the bottom is 21.2 percent. A historically working-class Latino neighborhood, Logan Square has seen an influx of restaurants, proposals for transit-oriented development, and young professionals, and has become the hotbed of a citywide debate about gentrification.
 Communities Whose Price Rebounds Are Above the City or Suburban Median
But that not all neighborhoods have seen this rise.
Like Logan Square, single-family home prices in Humboldt Park/North Lawndale have risen more than 40 percent from the bottom. But Humboldt Park/North Lawndale saw some of the sharpest declines in the city as well. From peak to trough, Humboldt Park/North Lawndale saw prices drop by 71 percent. Logan Square-/Avondale dropped by half that.
The median citywide decline was 46.6 percent. The charts below show the communities with the most volatile housing peaks or falls (swings greater than 50 percent), as well as the most stable markets.
 Communities That Had Peak to Trough Changes of 50% or More (approx. 2011-2014)
 Communities with Least Price Change from Peak to Trough (approx 2011-2014)
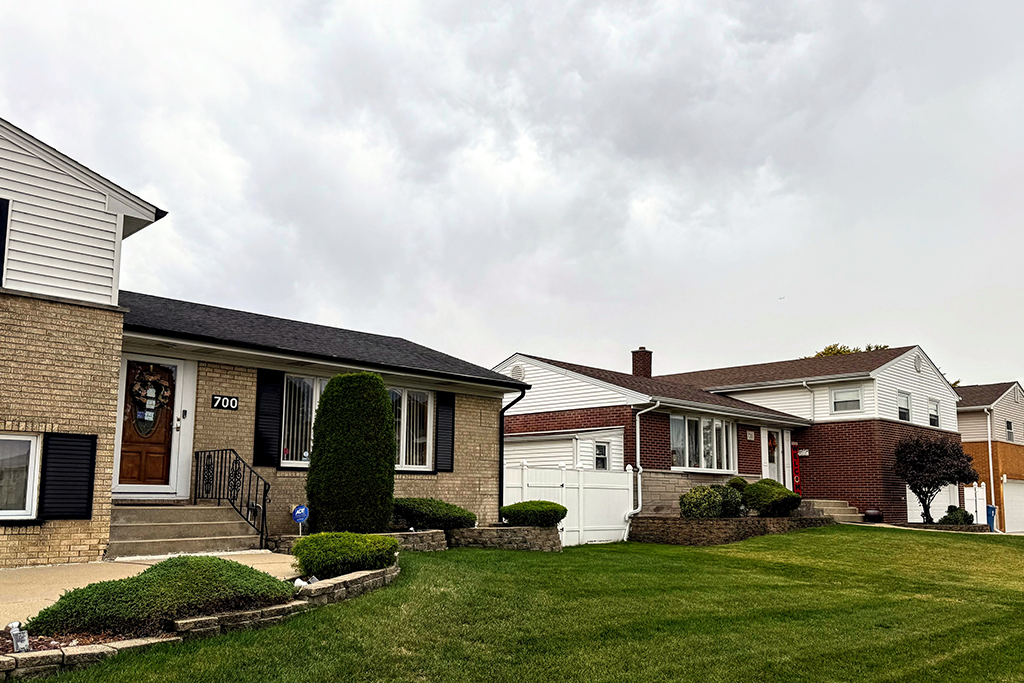
Even though home prices have increased considerably from the bottom, Humboldt Park’s home prices are still 60 percent below their peak prices. In other areas of the city, there has been very little recovery from the bottom. In South Chicago and Hegewisch, prices are up only 6.1 percent from their trough. In Chicago Heights and Park Forest, single-family homes are selling for only 8 percent more than they did at the lowest point.
So what drives recovery? Larger economic forces, housing supply, availability of credit to finance a mortgage, confidence in the neighborhood’s future, and the health of the neighborhood before the boom all combine to influence prices. A pivotal factor now is the share of owners who are underwater and essentially unable to sell.
A recent article in Zillow Real Estate Research notes that it will take a long time before some of the deepest underwater owners are able to sell.
“In fact, some homeowners trapped very deeply underwater may essentially be in negative equity forever,” the report states. “And those homeowners are much more likely to own America’s least expensive homes. Making matters worse, many homeowners in the bottom home-value tiers are not only underwater but very far underwater.”
It would take homeowners who are 20 percent underwater seven years to get into the clear, they calculate, assuming a price increase of 3 percent per year and assuming that the owner pays only the interest on the mortgage. Homeowners who owe 50 percent more than their homes are worth, or even double the amount their home is worth, will not get out from under for at least 10 years.
Negative equity, Zillow writes, is here to stay. “The days in which rapid and fairly uniform home-value appreciation contributed to steep drops in negative equity are behind us, and a new normal has arrived. Negative equity … will impact the market for years to come.”
Foreclosures, too, have shaped the story of neighborhood recovery. As we have reported before, foreclosures correspond with wide swings in prices from boom to bust and back again. High foreclosure areas like Humboldt Park have seen significant recent price gains, in some areas more than 30 percent year over year, double the rates in areas with the fewest foreclosures. But while the price appreciation is welcome, it is a long climb out from under.
What these numbers do clearly reveal, however, is where policymakers can target resources for those neighborhoods still reeling from the housing crash.
Photo/ Mike Brown