In December of last year, the Institute for Housing Studies released a new tool that helps neighborhoods in Chicago plan for change. We heard quickly from community groups about how helpful the data and planning tools were to their efforts to plan for and respond to gentrification or its counterpart, long-term disinvestment.
“You can organize residents and say ok city, prices are going high, people are going to be displaced, what are you doing to preserve affordable housing there?” long-time activist Diane Limas of Communities United told us shortly after the tool’s release. For Roberto Requejo of Elevated Chicago, the maps underscored what he had been working against—displacement by disinvestment. “Using the maps, you can go back 10 or 20 years and see the actual trend of disinvestment. We as a city have not been paying proper attention to this.”
It was a classic example of how applied research can help people make their communities stronger for all.
But it was also a learning experience for us here at DePaul. The project illustrated how IHS’s applied research model can bring together students and faculty to produce work that benefits neighborhoods and the city.
Answering a Driving Question
The project was complicated. When a past study of ours revealed that the 606 Trail had caused a sharp jump in property prices along its previously affordable western half—along with accompanying displacement pressures—we wondered whether similar data could be used to warn other communities when they should prepare for similar pressures. Investment is often welcome in under-resourced neighborhoods—until it begins to push long-time residents out. So what if neighborhoods like Woodlawn, where the Obama Presidential Center will be, or Pilsen, where a version of the 606 Trail is planned, could welcome the positive effects of investment but avoid the displacement?
What we needed was some kind of leading indicator that could help city planners, neighborhood groups, and others get ahead of potential gentrification.
Big Data and Maps
We turned to Dr. Raffaella Settimi, associate dean of the College of Computing and Digital Media here at DePaul, to develop the categories of vulnerability. To do so, we needed to find out which neighborhoods had high concentrations of vulnerable populations or vulnerable housing types. Settimi and her graduate students pulled public data on renters versus owners, property types, housing affordability, and cost burden for Chicago census tracts. They plugged that into a data model that she and her students developed. The result was six market types and three common vulnerability characteristics: high cost burden and lower-income renters, families, and seniors. If prices started to rise, neighborhoods within those characteristics would be the first affected.
Collaborating with IHS was very beneficial for her students Settimi told us. They were able to investigate more complex techniques and they saw a direct application of their work, along with the impact their research could have.
Settimi and her students also appreciated the context we could bring to the work. Working together we could unpack what the data were showing and help her students better interpret the results. They also gained from the insights from outside experts when they worked on the Regional Housing Solutions tool, a project between IHS, Chicago Metropolitan Agency for Planning, Metropolitan Mayors Caucus, and the Metropolitan Planning Council that created a subregional housing market analysis.
With the data in hand, we needed to tie these vulnerable typologies to house prices. We wanted to know where prices were rising and where they were stagnant. If a vulnerable neighborhood was also seeing rising prices, displacement was a concern.
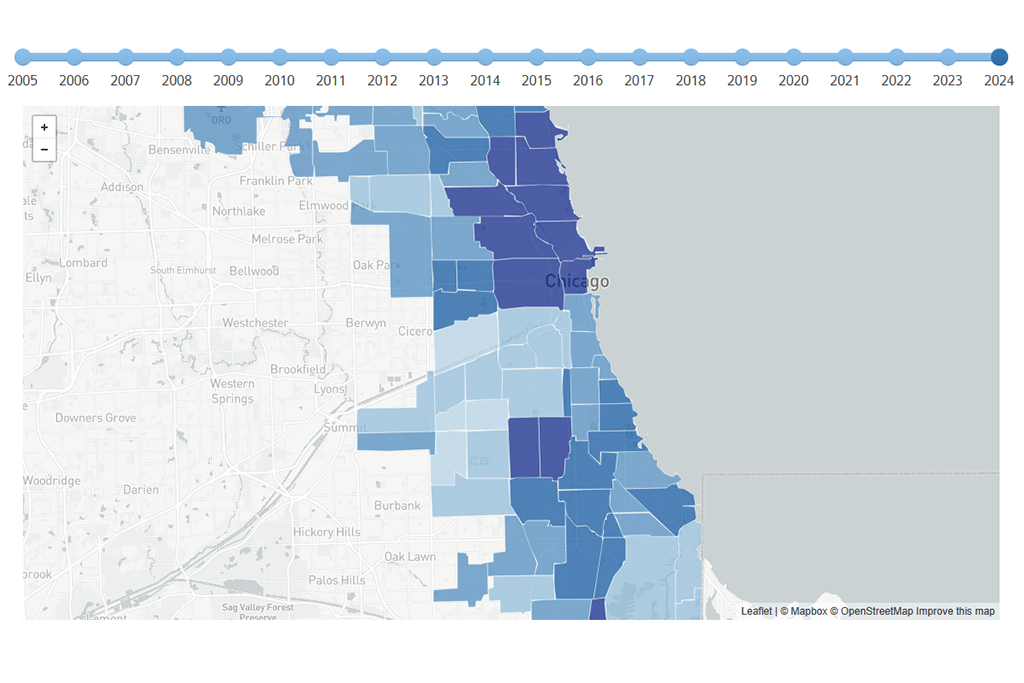
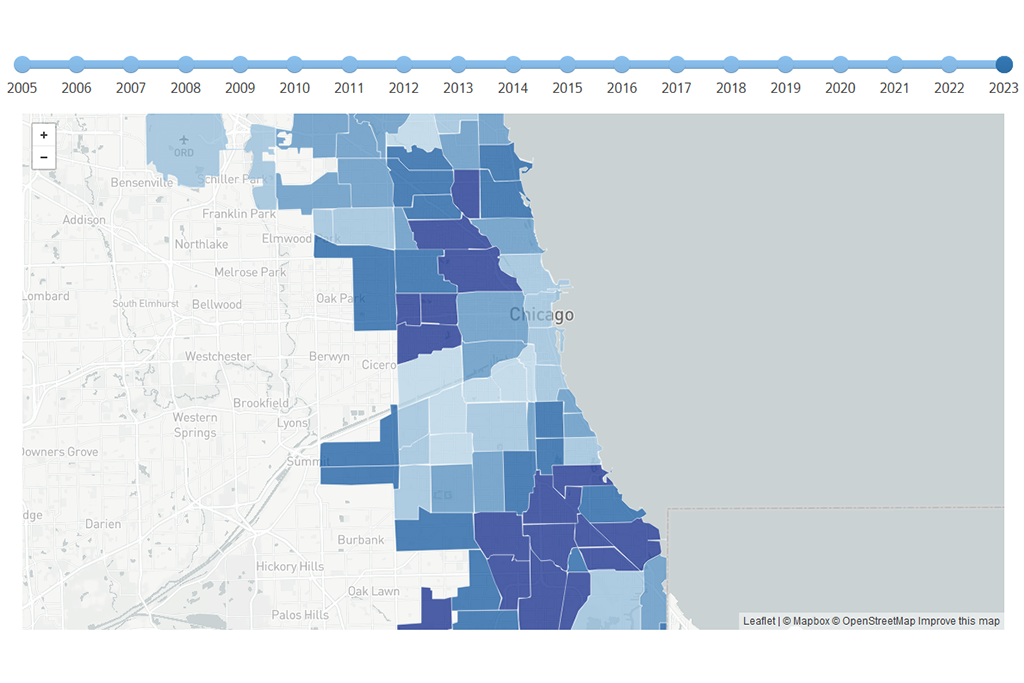
For that, we turned to Joyce Percel, a graduate student in Sustainable Urban Development and a student employee at IHS. Joyce mapped out all the property sales of one- to four-unit buildings between 2012 and 2016 and applied spatial analysis techniques to give us a sense of how prices had changed since 2012. We could then link that to our neighborhood categories.
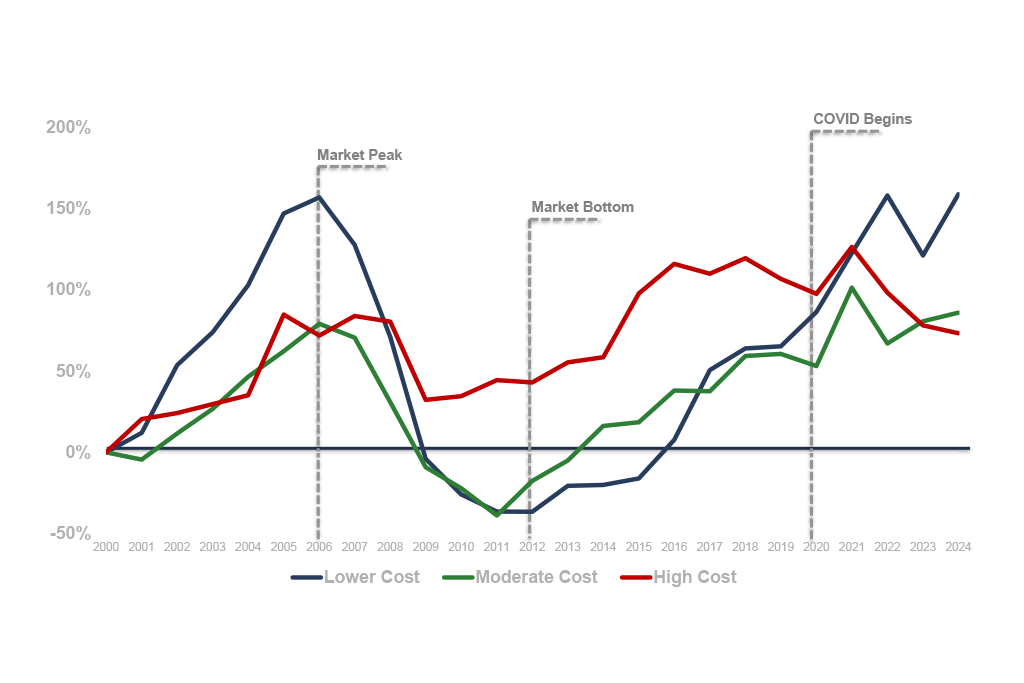
 Maps of High-, Moderate-, and Low-cost Areas with Rising Prices and Vulnerable Residents
Percel was interested in using data to tell a story in support of under-resourced communities. This tool was one way to do that. And it also allowed her to do research that had a direct impact on communities. Their input and insights meant that she was never doing research in a vacuum.
The end result, we hope, will help neighborhoods handle investment in ways that benefit everyone. For us, projects like these give us a more nuanced and textured understanding of a neighborhood and of our own work.
Community organizations have been using these maps in many different ways. We hope to continue this kind of work for communities’ benefit. Through applied research projects like Mapping Displacement Pressure in Chicago, our other research, and community engagement, IHS is deepening DePaul’s distinctive connection to the global city of Chicago. Our applied research model allows us to remain a critical resource for Chicago's community development policymakers and practitioners while also providing DePaul faculty and students with a platform to connect what they teach and learn in the classroom to real-world issues affecting Chicago. We benefit from DePaul’s focus on giving back to the city and the ability to tap into the deep and diverse talent pool of students and faculty to help us move the university’s mission forward.