For 4 million households, the housing crisis still has a stranglehold on their lives. As prices started to plummet in 2007, many saw their home’s value sink below what they’d paid for it. Negative equity, or an “underwater” home, is what results when a house is worth less than what the homeowner owes on the mortgage. In the worst housing markets at the depth of the crisis, an unprecedented 60 to 70 percent of households were underwater.
Homes have long been considered wealth-building assets, but for many homeowners today, in particular low-income, minority households, they are burdens—traps or sources of inescapable debt.
Many homes have resurfaced in the years since, but negative equity is still commonplace in some markets. The Upper Midwest and the Central Valley in California, for example, are two spots still hard hit, as are rural areas generally. According to the Center for American Progress, in nearly 1,000 counties across the country, the share of underwater homes is either stagnant or increasing. Among larger cities in early 2016, Las Vegas, Miami, Chicago, Washington, D.C., and New York had the highest share of homes underwater, ranging from nearly 20 percent to 6 percent according to Core Logic. In contrast, San Francisco had nearly no underwater homes (99.4 percent had equity in their homes).
This variation points to the importance of looking at local conditions in real estate, and not just between cities. Even within cities, the rate of underwater homes varies across neighborhoods or communities.
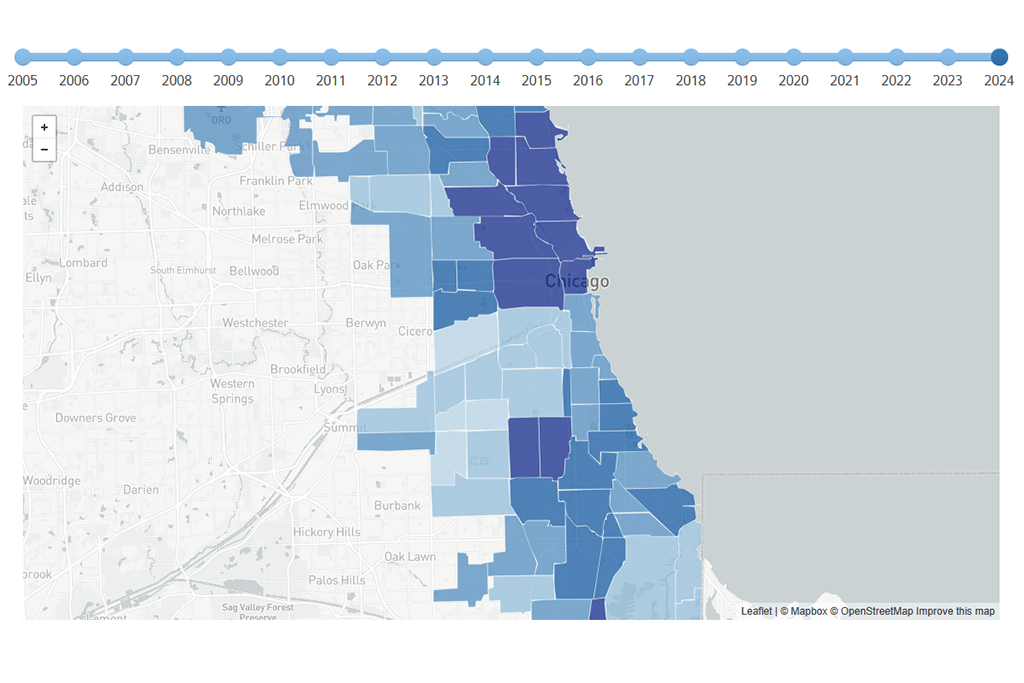
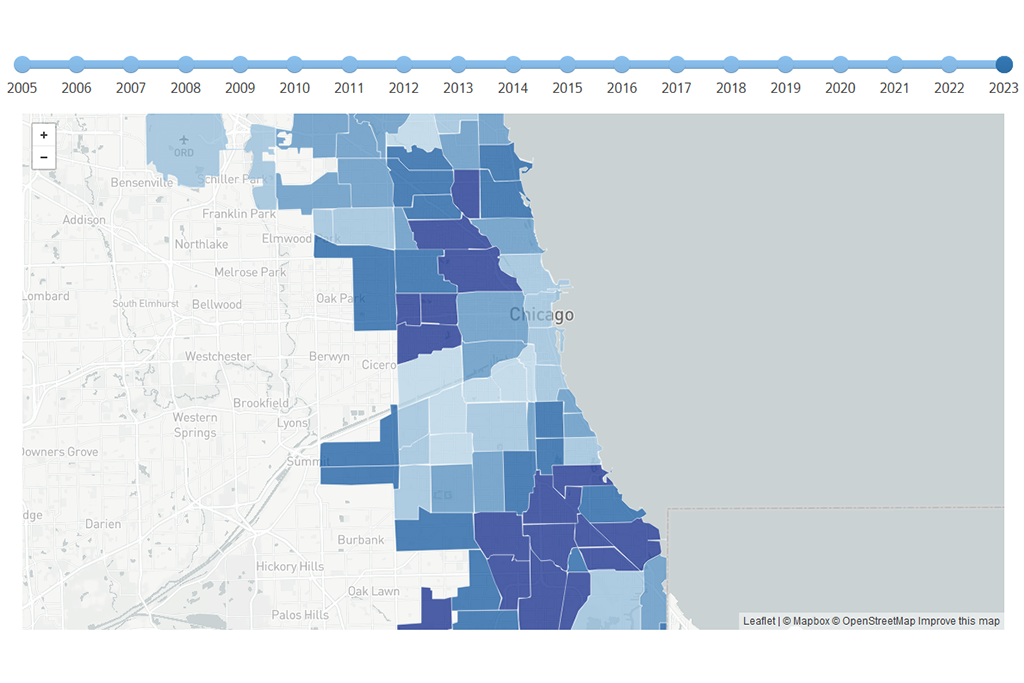
We’ve developed the Cook County House Price Index to help track variation in the local housing market and better understand which submarkets have fully recovered from the housing crisis and which have not. Our fourth quarter 2015 house price index found that three areas in Cook County—Lincoln Square/North Center, Lake View/Lincoln Park, and West Town/Near West Side—reached or exceeded previous peak levels in house prices. In other areas, largely low-income, often African-American neighborhoods, prices were still more than 55 percent below peak levels. Many of these homes may indeed be underwater.
Current Prices Relative to Previous Housing Bubble Peaks, 2015 4Q

The effects of negative equity are wide-ranging. Owners of underwater homes cannot draw on home equity to invest elsewhere, and they may be less likely to spend money at local businesses and on local services. Uneven recovery has contributed to worsening racial inequality. ZIP codes where black residents are the majority are twice as likely as white ZIP codes to have homes that are now worth less than they were in 2004. The uneven recovery across the country is also exacerbating disparities between affluent Americans and everyone else. Home values have increased the most in areas where homes were already expensive.
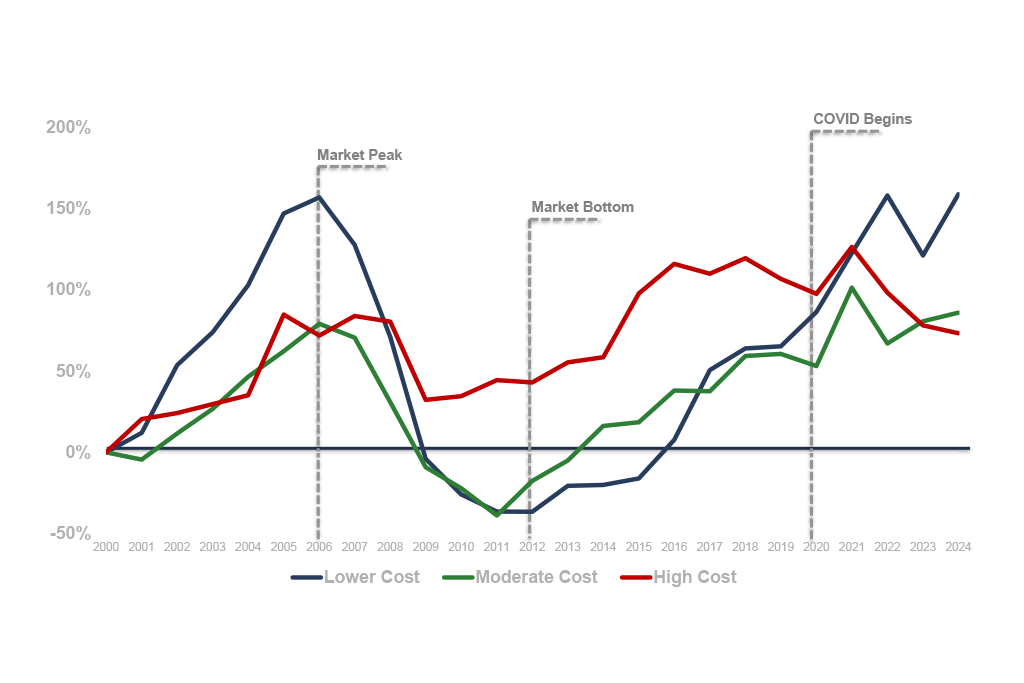
These patterns are clearly reflected in Cook County. As the table shows, areas that were the highest-cost in 2000 saw much larger increases in home values between 2000 and 2015 than the lowest value areas. Because those properties started out at a higher cost, the percent increase in value translates to substantial dollar increases. In Lake View/Lincoln Park, for example, values increased by more than 76 percent, that translates to more than $380,000 in potential wealth through home equity. In contrast, a typical home in Auburn Gresham/Chatham saw values increase by just over 4 percent. That translates to less than $4,000 in potential wealth.

Such patterns have caused some to question the value of homeownership as a wealth building strategy, particularly for lower-income households who often cannot afford to buy properties in the most stable markets and who may be less able to bear the financial risks of market instability. The question going forward is, will owning a home, once the anchor of the middle class, help reduce inequality or exacerbate it?
IHS will continue to track recovery in our region, releasing quarterly updates on house prices in Cook County.
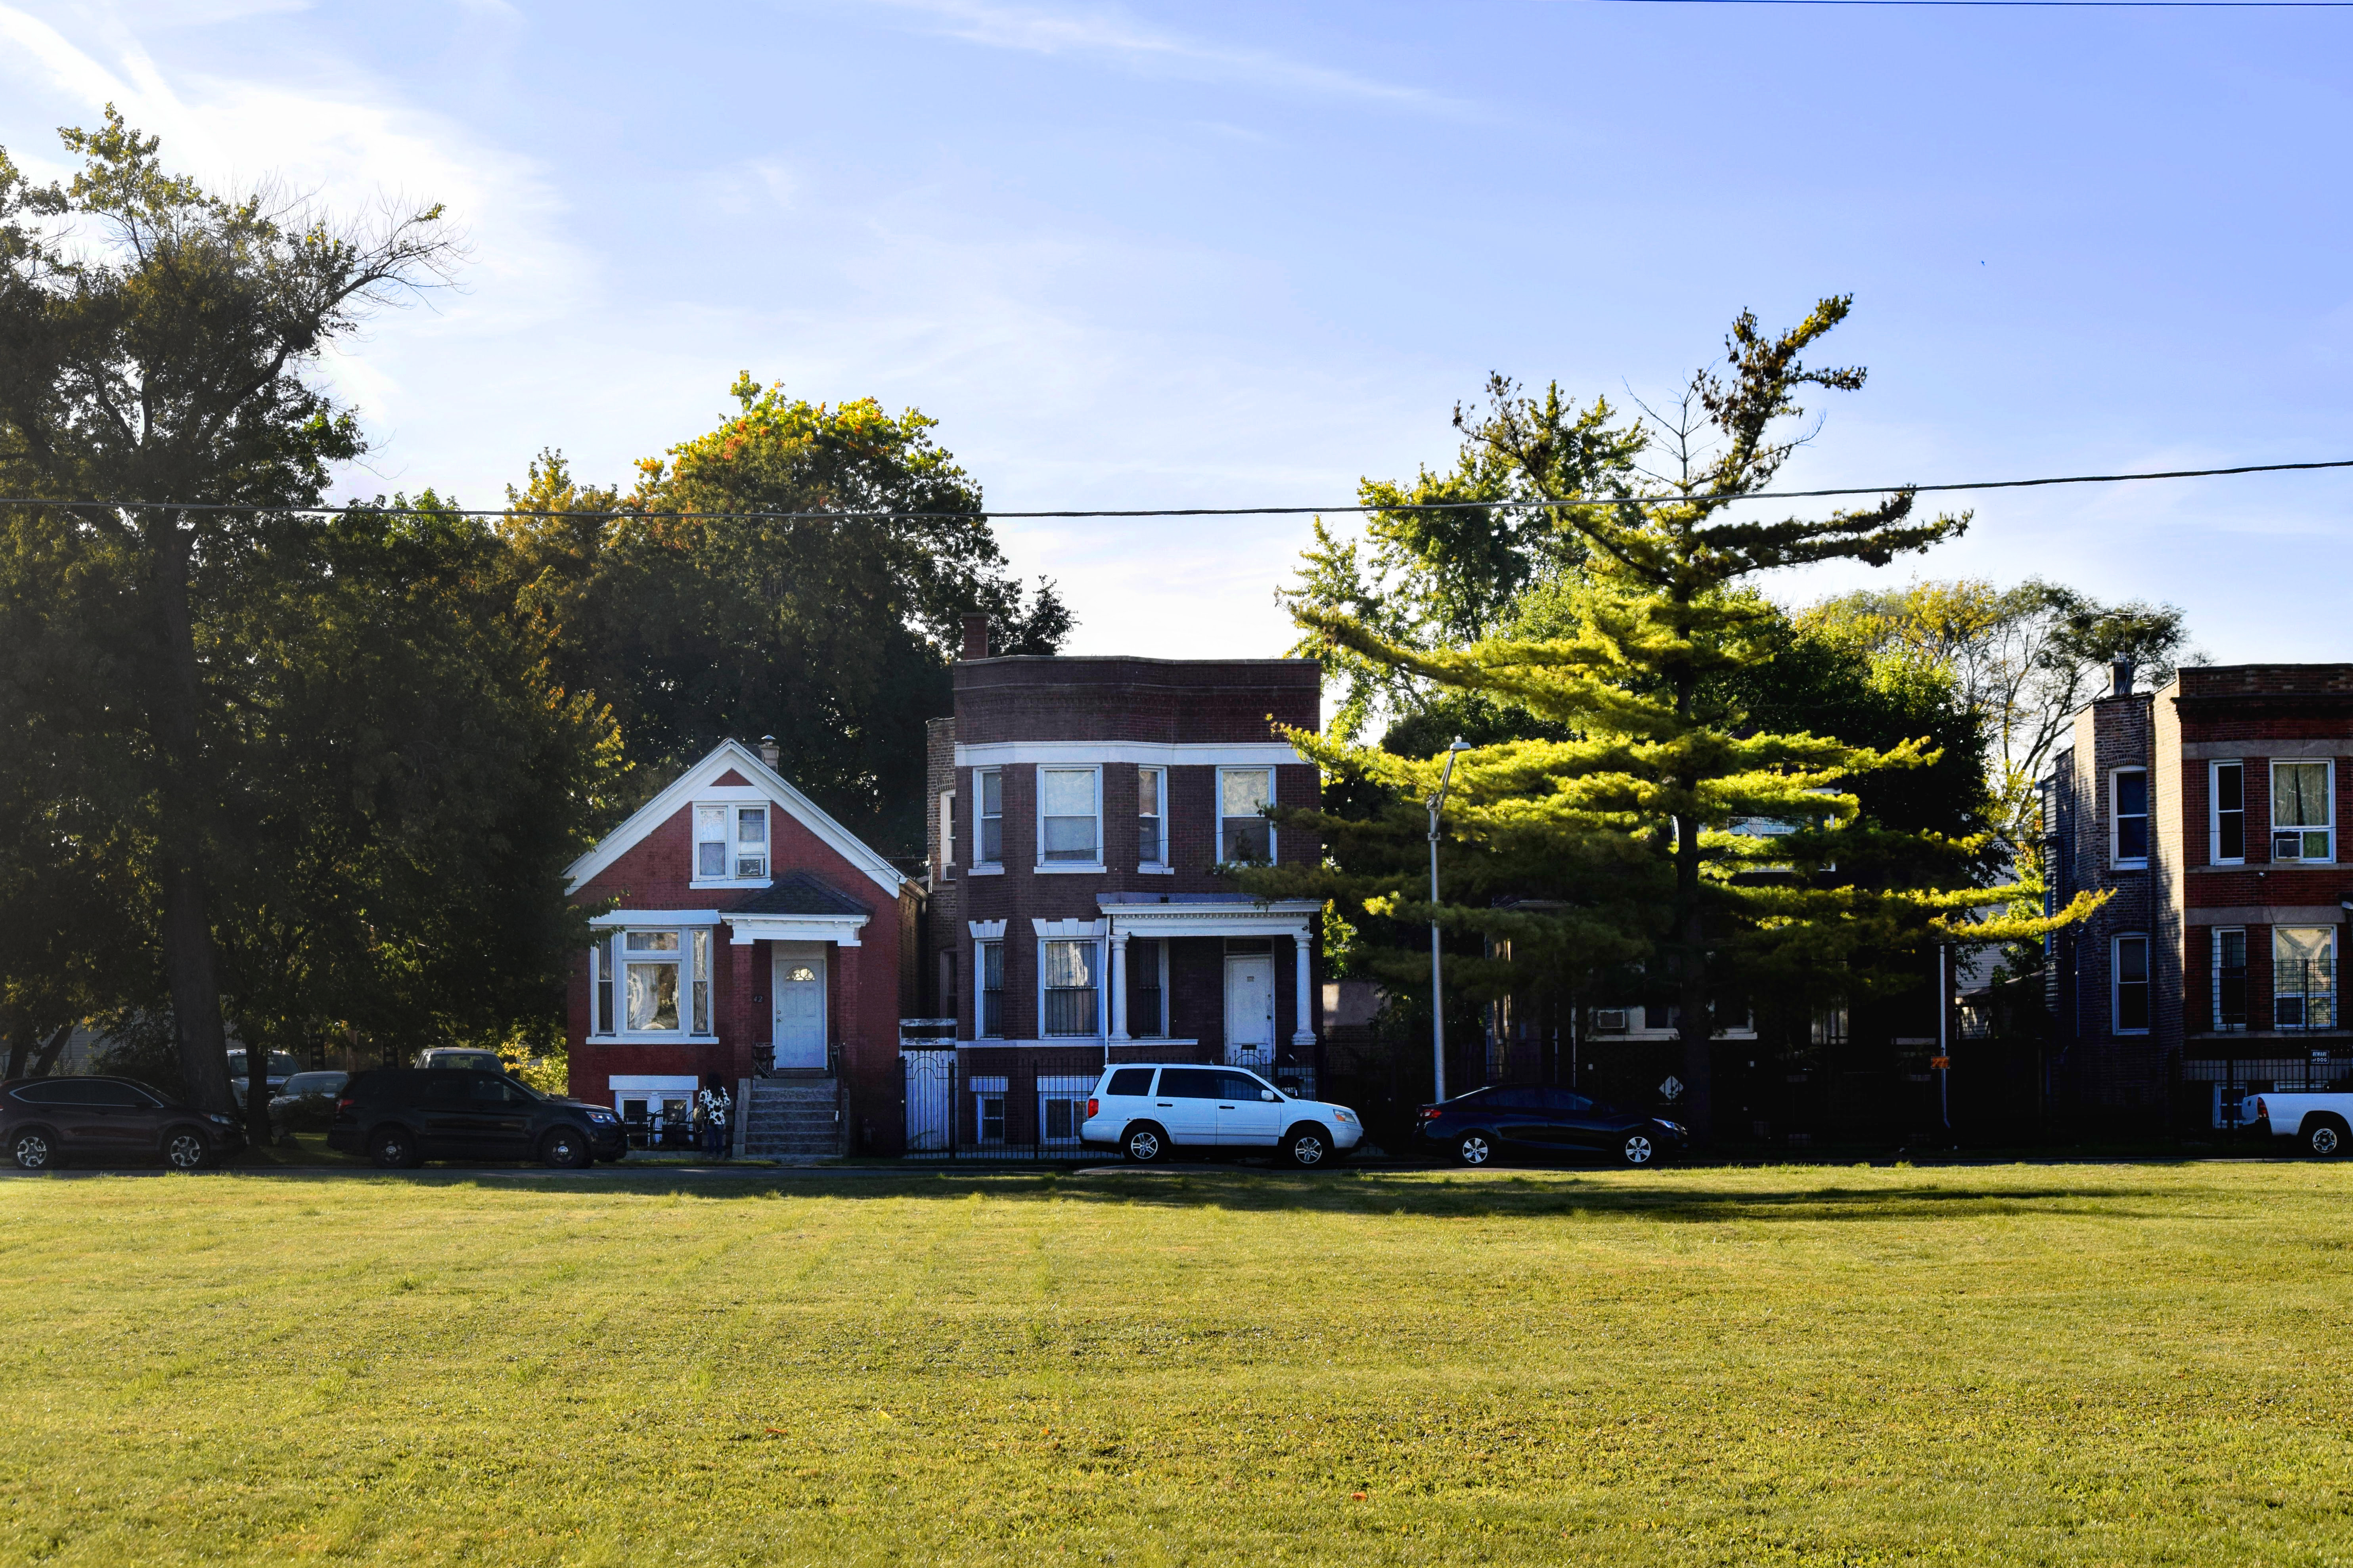
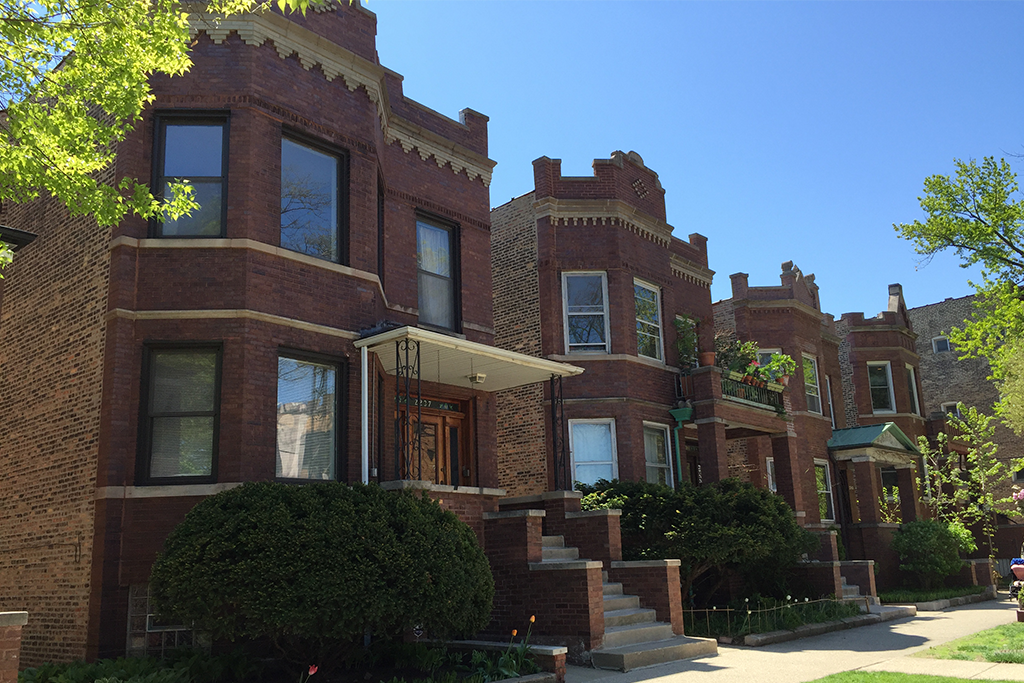
Photo/Ian Freimuth