The housing crash may have been national, but the recovery is still local. Our updated Housing Price Index, released today, underscores how national data can mask the hyperlocal story of continued struggle—especially in the area of building economically healthy neighborhoods--and how local data can support more targeted development strategies.
By most indications, housing prices are cooling off across the United States. The latest data show the smallest price increases since late 2012. According to the Global Property Guide, the S&P/Case-Shiller seasonally adjusted national home price index shows a year-over-year increase of 4.26 percent in the first quarter 2015 compared to first quarter 2014. The median sales price for new homes dropped to $281,800, a 1.8 percent decline, between June 2014 and June 2015, according to the U.S. Census Bureau.
National trends and projections are important in guiding federal housing policy, from mortgage interest-rate decisions to incentives for new homebuyers. Yet the national data say little about what most investors, city planners, economic developers, and homeowners want to know: what’s going on in my community?
In many ways, house price trends are a kind of APGAR score for the health of a neighborhood. Doctors use the APGAR score (appearance, pulse, grimace, activity, and respiration) as a gauge of whether a newborn needs emergency care. Likewise, housing prices can be a leading indicator of a neighborhood’s health by capturing the supply and demand dynamics of neighborhood housing markets.
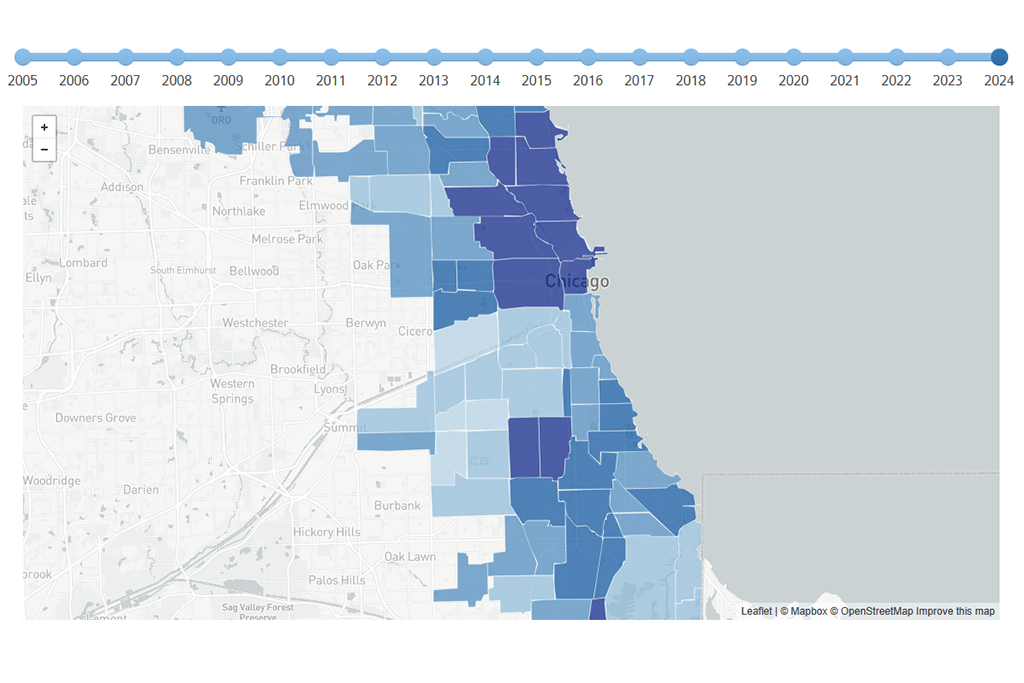
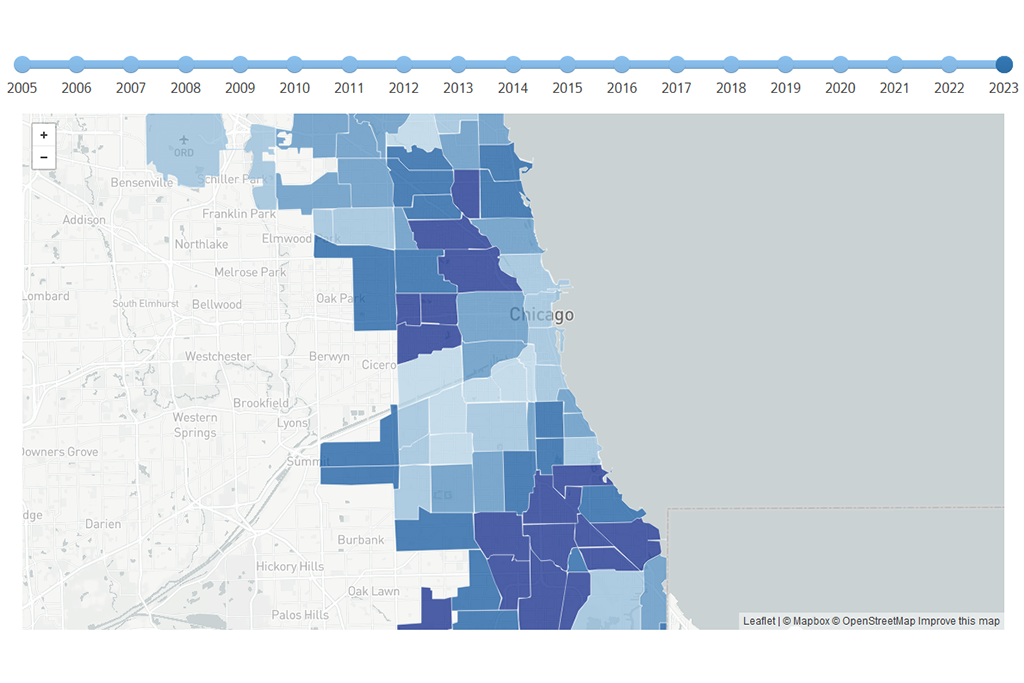
Take, for example, Auburn Gresham/Chatham, a neighborhood nine miles south of the Loop. A historically stable and predominantly African-American community , the area, according to our price index, saw a 10.5 percent year-over-year price increase as of the second quarter 2015. That increase was among the 10 highest in the Chicago metro area. In contrast, the community with the poorest performance, Calumet City/Harvey, saw a 0.7 percent decline in year-over-year home prices.
On the surface, one could surmise that Auburn Gresham/Chatham is doing well. But other local housing indicators paint a different picture.
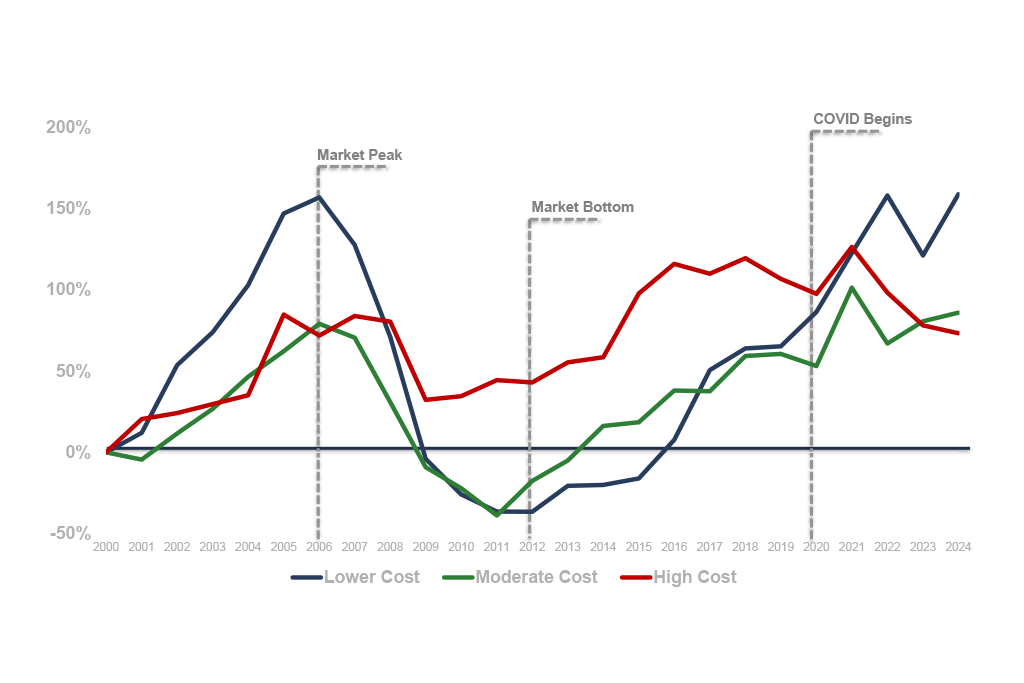
The apparent improvement in Auburn Gresham/Chatham masks an uneven recovery and a more complicated story. The figure below highlights price trends for a group of submarkets in Cook County, including strong growth Logan Square/Avondale, declining Calumet City/Harvey, and middle of the road Park Ridge/Des Plaines. Auburn Gresham/Chatham saw large swings in prices during the housing crisis, and, despite recent improvement, its climb back is far from over.
 Figure - Price changes since 2000 for selected Cook County submarkets, 2000 1Q to 2015 2Q
Compared to 2000, in fact, overall prices have risen about 4 percent in Auburn/Gresham. And that means, as we discussed this spring, that over the course of more than a decade, homeowners have seen little appreciation in their home values.
Our index estimates that a typical single-family home in Auburn Gresham/Chatham appreciated $3,840 between 2000 and second quarter 2015. In contrast, in West Town/Near West Side, the price of a home purchased in 2000 gained 127 percent. The lucky homeowner there gained $418,872 in value. (A median single family home is estimated to have increased from $330,000 in 2000 to $748,872 in second quarter 2015).
Keep in mind, that our price index model controls for property characteristics, location relative to amenities (or lack of), and if a property is a distressed sale. Therefore, it allows for an apples-to-apples comparison of price trends for the “typical” nondistressed single family home in different submarkets.
Clearly, something is going on in Auburn Gresham/Chatham to keep it from rebounding from the recession. While its “APGAR score” might not send it to the emergency room, it is an area in need of care.
Neighborhoods like Chatham—with their stable housing, steady retail, and a strong sense of community—are critical to the City’s overall vitality. Our data can help stakeholders target limited resources to the communities most in need of strategic interventions that rebuild demand for housing. After all, a city’s health is in its neighborhoods.