The Housing Market Conditions Report is released in conjunction with the annual update of the IHS Housing Market Indicators Data Portal. The objective of this report is to help users of the IHS Housing Market Indicators Data Portal interpret IHS market conditions indicators such as levels of foreclosure distress, the characteristics of property sales, or levels of mortgage credit, and how they vary across the region in the most recent data.
IHS’s housing market indicators were created to help users understand key trends in local housing market conditions and to help stakeholders develop and target policies and programs to improve neighborhood stability. IHS’s Housing Market Indicators Data Portal includes data from 2005 to 2015 for Cook, DuPage, Kane, Lake, McHenry, and Will Counties. It also includes filters to further break out data for 261 metro area municipalities, 77 City of Chicago community areas, and 50 City of Chicago wards. Data for Cook County includes further detail of conditions data by property type.
This edition of the Housing Market Conditions Report focuses on key trends in market activity in 2015 and illustrates how conditions vary across the Chicago metro region through interactive census tract-level maps. These maps complement the data available on the Data Portal by detailing the local variation in certain indicators even within a community.
Key trends in 2015 Housing Market Conditions Indicators
Foreclosure Activity
In most communities across the region, foreclosure activity is at a new low point. Last year IHS reported broad declines in foreclosure activity and a clearing of the foreclosure pipeline in many communities, a trend that continued in 2015. While fewer new filings and a reduction in the backlog of foreclosure cases has helped many practitioners pivot toward focusing on interventions that address the legacy of the crisis, certain neighborhoods still show elevated foreclosure levels and homeowners in these neighborhoods will likely need continued attention and assistance navigating the foreclosure process. The interactive map below shows areas in the region where foreclosure activity remains elevated in 2015. These areas include communities on the south and west sides of the City of Chicago, in southern Cook County, and in harder hit pockets of Lake County and parts of Elgin, Aurora, and Joliet.
To view an expanded map of foreclosure filing activity in 2015, click here. To examine trends and patterns in foreclosure filing and real estate owned (REO) activity at different units of geography throughout the Chicago metro region, use the IHS Data Portal to navigate across data sets and geographies.
Property Sales Activity
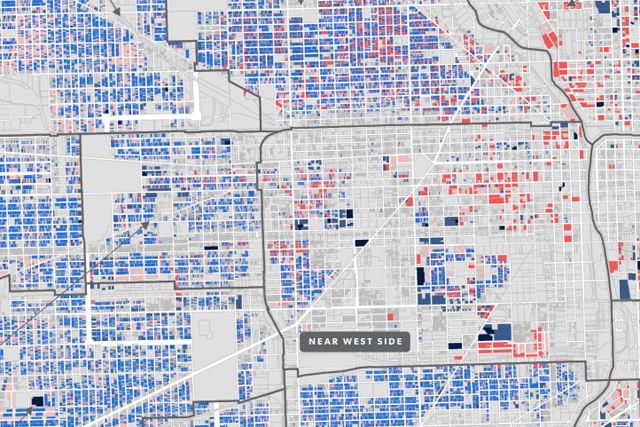
One of the key indicators of neighborhood health is housing turnover or the share of residential properties in a community that sell each year. Turnover illustrates how active a local real estate market is and can indicate demand for housing in an area. While turnover remains weak regionally in 2015 compared to even year 2000 levels, the map below shows that turnover is concentrated in certain markets. While nearly every area has shown some price recovery since the worst of the recession, IHS's analysis has illustrated that areas with substantial turnover also have had strong recoveries in single-family house prices since the housing crash. The map below shows the level of turnover in the region by census tract in 2015. For an expanded map, click here.
Over the course of the housing crisis, investor buyers became significant players in the housing market, purchasing foreclosed or inexpensive properties to flip or manage as rental properties until the market improved and they could be sold to owner occupants. After peaking in 2013, increasing single family house prices and the drying up of the foreclosure pipeline led to declines in investor activity— although levels remain elevated in 2015 compared to levels pre-crisis. The map below shows areas where investor activity remains concentrated in certain parts of the region, examining the share of sales that were purchased by a self-identified business buyer in 2014. It shows that the areas with the highest levels of investor activity include parts of South Cook County, and the south and west sides of the City of Chicago, areas where prices continue to struggle and where foreclosure activity remains high.
To view an expanded map of business buyer activity in 2015, click here. To further examine patterns of transaction activity, including levels of investor activity and low-value sales at different units of geography throughout the Chicago metro region, use the IHS Data Portal to navigate across data sets and geographies.
Mortgage Activity
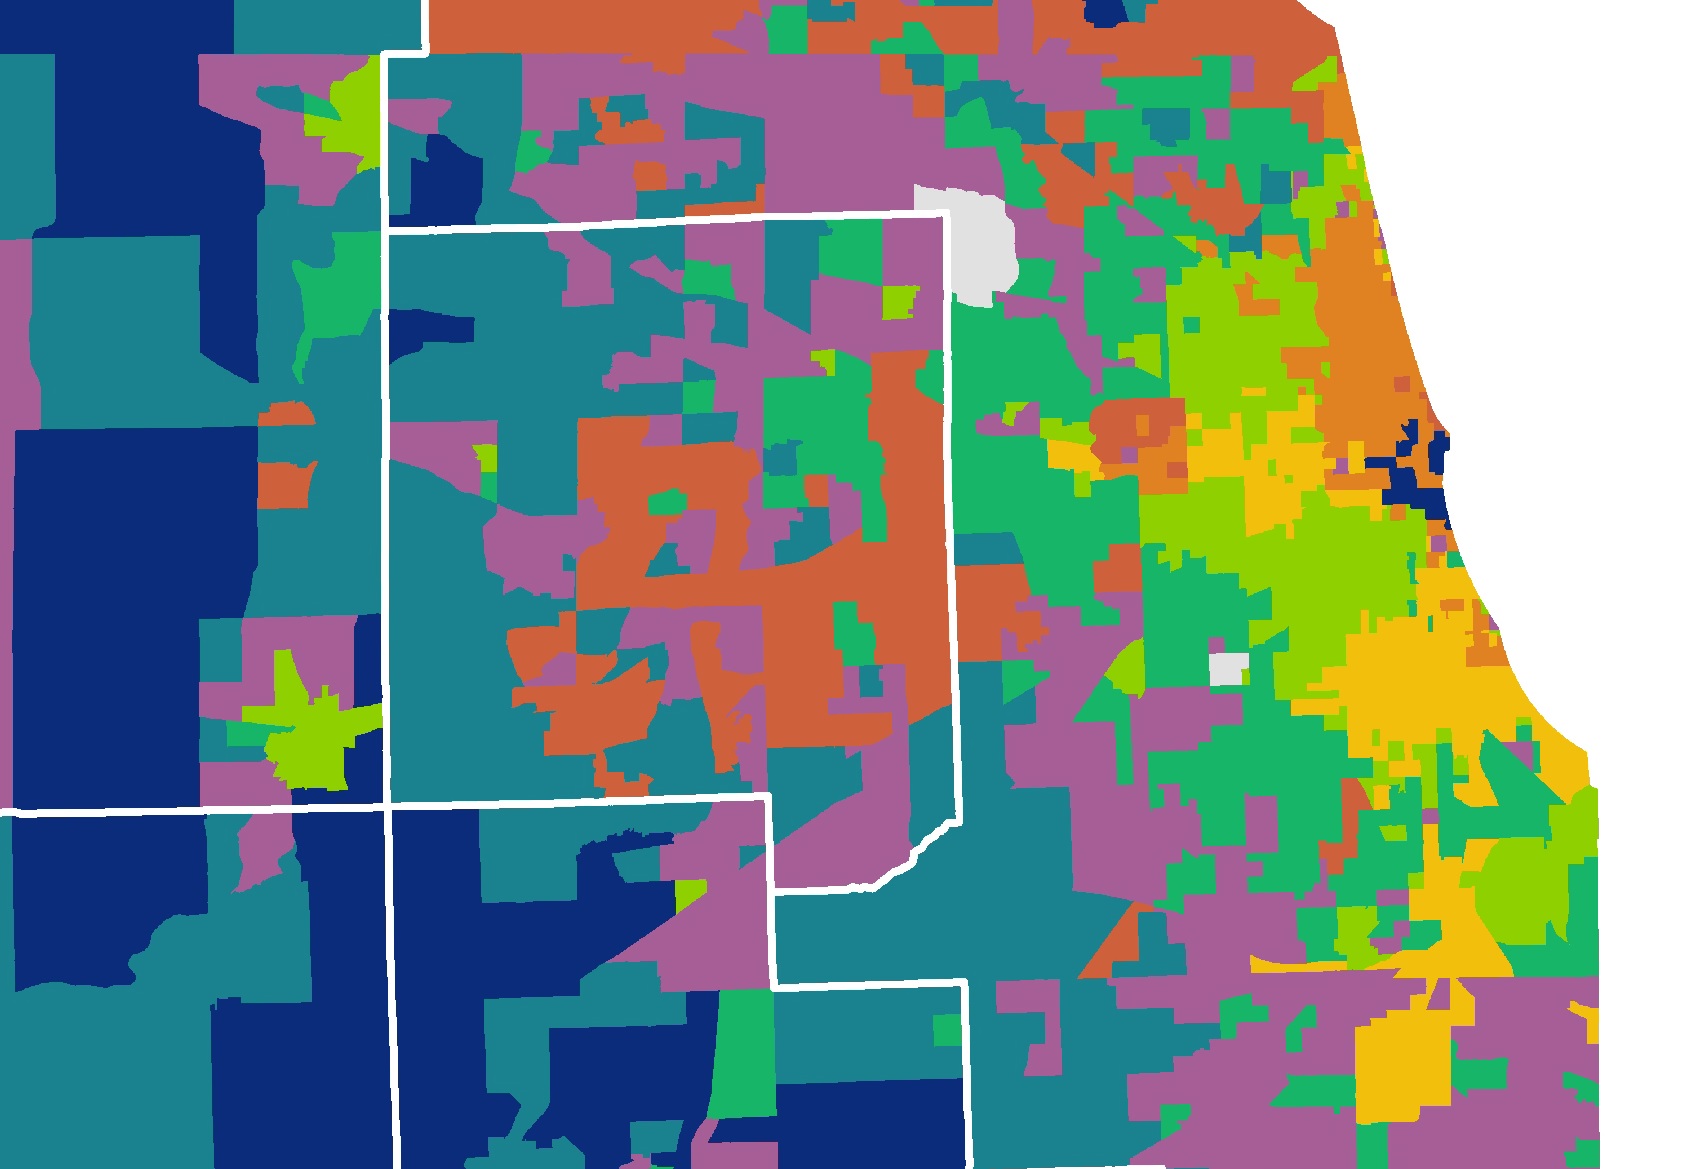
Region-wide, mortgage originations remain weak in 2015 relative even to pre-crisis levels. IHS research has documented the dramatic decline in mortgage credit following the boom years, the emergence of cash buying as a large share of total purchase activity in many communities, and the variation in mortgage credit for certain types of propertiesand across certain neighborhoods. In 2015, mortgage activity continues to be concentrated in certain markets where demand for owner-occupied housing is strongest, and where negative market conditions such as high levels of vacancy and distressed properties are less present. The map below illustrates the geographic variation in mortgage lending activity in greater detail in the region— showing that this phenomenon is particularly acute in the City of Chicago where the density of mortgage credit increases substantially north of 18th street.
To view an expanded map of 2015 mortgage activity, click here. To further examine patterns of mortgage lending activity at different units of geography throughout the Chicago metro region, use the IHS Data Portal to and navigate across data sets and geographies.
For more information on the data sets, access information specific to housing stock, property sales, mortgage activity, foreclosure filings, foreclosure auction or vacancy data in the embedded links or at the sidebar to the right. For more information on how to use these data, see our blog post tutorials on mortgage and property sales data. For questions, custom analysis or technical assistance contact IHS Associate Director Sarah Duda. To be notified about reports, analysis, data or blog posts and to give us feedback, follow us on Twitter, like us on Facebook, or join our LinkedIn Group.