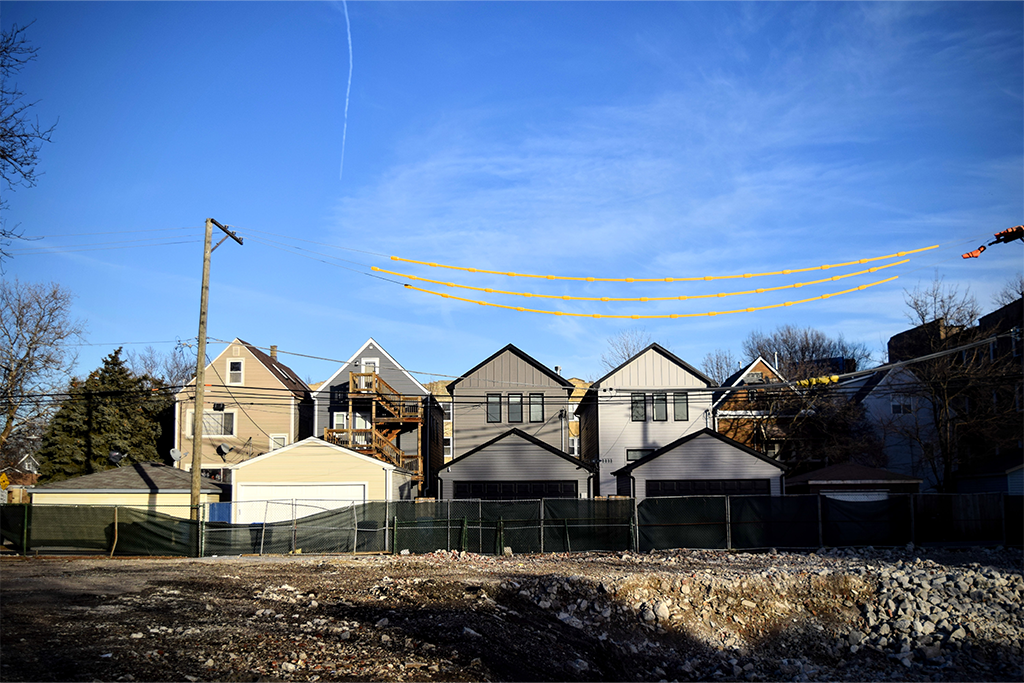
Photo: Evelyn Ryan
The City of Chicago has struggled for decades to address issues related to an abundance of vacant land, largely concentrated in the city’s Black neighborhoods. High levels of vacant land in Chicago’s communities of color are the product of decades of discrimination and disinvestment from public and private entities, followed by long-term population loss, property abandonment, and ultimately demolition of distressed, deteriorating structures. There are numerous obstacles that prevent these lots from being redeveloped or repurposed, and they can often sit vacant for years despite significant community efforts. High concentrations of vacant land can have a broad range of impacts on communities and residents including negative impacts on nearby property values, increases in crime, increased exposure to environmental hazards, and negative effects on mental health, physical activity, and social cohesion.
A particularly vexing aspect of Chicago’s vacant land challenge is the large concentration of these vacant lots located near CTA transit stations. The Chicago Transit Authority (CTA) operates one of the largest heavy rail rapid transit systems in the country. There are over 125 CTA train stations in neighborhoods within the city limits. Access to these transit stations is typically considered a neighborhood amenity, and since 2013, Chicago has implemented different types of transit-oriented development policies that create incentives to develop dense housing and walkable communities near CTA transit stations. While these policies have successfully attracted new investment to many higher-income Chicago neighborhoods, they have not had the same success in the city’s predominantly Black South and West Side communities.
Recent efforts in Chicago have worked to prioritize Equitable Transit Oriented Development (ETOD) strategies that promote dense, mixed-use, pedestrian-oriented development near transit hubs that are 1) accessible to Chicago residents of all socioeconomic and race/ethnic backgrounds and 2) mitigate displacement pressures driven by forces tied to gentrification and long-term disinvestment. Elevated Chicago has been a local and national leader in highlighting the importance of ETOD and developing policies and programs to attract equitable investment near transit.
As a part of this work, IHS partnered with Elevated Chicago, Rudd Resources, the Garfield Park Community Council, and the Endeleo Institute on the project Chicago’s Vacant Lots Near Transit: An ETOD Deep Dive. The project examines the impact of vacant lots near transit on the South and West Sides via two case studies: one in East Garfield Park near the Kedzie/Lake and California/Lake Green Line CTA stations and the other in Roseland/Washington Heights near the 95th/Dan Ryan Red Line CTA station. The project examines demographic, economic, and housing market conditions in the two communities and showcases videos featuring community members describing the impact of vacant lots near two major transit hubs. The project also outlines key takeaways from community engagement conversations and provides resources and next steps for those interested in vacant lots and ETOD in Chicago.
To support this work, IHS developed an in-depth analysis of City-owned and privately-owned vacant land across Chicago.i The analysis highlights the proximity of vacant land near CTA train stations, the distribution of these vacant lots by census tract race/ethnic composition, Chicago Community area, and CTA train station. The data appendix includes these data as well as data aggregated by City of Chicago ward. The section below highlights some of the data and analysis found in the Elevated Chicago report.
Basic Facts about Vacant Land in Chicago
City-owned vacant land – Over the years, the City of Chicago has acquired vacant land through a range of channels. These channels include the foreclosure of demolition liens, the Cook County tax scavenger sale, property condemnation, and direct purchase. Figure 1 explores the distribution of both City-owned and privately-owned vacant land in Chicago. It shows that as of July 2023, the City owned roughly 8,800 vacant lots, the vast majority of which are zoned for residential use. City-owned vacant land is highly concentrated in Chicago’s communities of color. Less than one percent of City-owned vacant land is in majority white communities, while over 80 percent of City-owned vacant land is in communities where the population is at least 80 percent Black.
Privately-owned vacant land – There are over 3.5 times as many privately-owned vacant lots in Chicago than City-owned lots. Privately owned vacant land can be challenging to understand, categorize, and catalog, as they represent properties from a range of ownership types and at different redevelopment stages. While some properties are temporarily vacant awaiting planned redevelopment, others may sit vacant for decades and be severely tax delinquent. It can be difficult to find information on who owns privately-held vacant land, and it can also be challenging to obtain control over these sites. Data from the Cook County Assessor indicate that there were nearly 32,000 privately owned vacant lots in Chicago in Tax Year 2021. Figure 1 shows that, similar to City-owned lots, the vast majority of privately owned vacant lots are located in non-white communities. Just over eight percent of privately owned vacant lots are in a majority white community, while nearly 60 percent are in communities that are at least 80 percent Black.
Figure 1. Distribution of City-Owned (As of July 2023) and Privately-Owned (Tax Year 2021) Vacant Land by Neighborhood Race/Ethnic Composition in Chicago
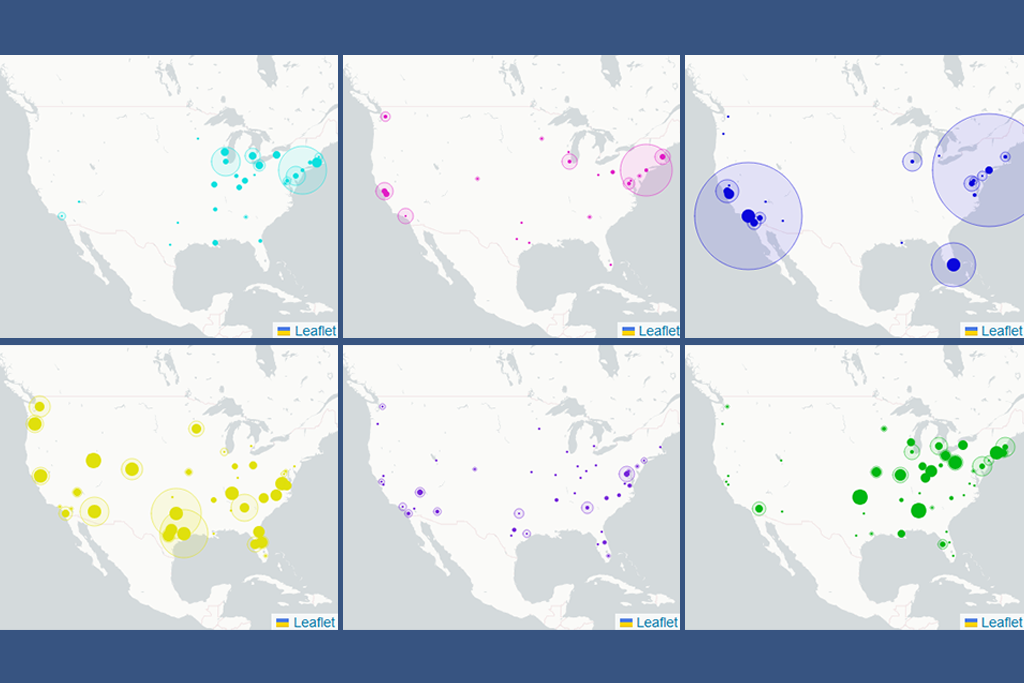
Vacant land near transit – A substantial portion of Chicago’s vacant land is close to a CTA train station. Over 43 percent of Chicago’s City-owned vacant land is located within ½ mile of a CTA train station, and 90 percent of these City-owned, transit-accessible lots are in predominantly Black communities. Privately-owned vacant land near transit follows a similar pattern. Roughly 35 percent of Chicago’s privately-owned vacant land is located near a CTA train station, and over 68 percent of these privately-owned, transit-accessible lots are in predominantly Black communities. In total, there are roughly 3,400 City-owned vacant lots and nearly 7,500 privately-owned vacant lots near CTA stations in predominantly-Black communities. Figure 2 highlights the citywide distribution of both City-owned and privately-owned vacant land that is located within a ½ mile of a CTA station by the underlying race/ethnic composition of the census tract.
Figure 2. Distribution of City-Owned (As of July 2023) and Privately-Held (Tax Year 2021) Vacant Land within ½ Mile of a CTA Train Station by Neighborhood Race/ethnic Composition in Chicago
Figure 3 highlights the top 10 City of Chicago Community Areas with the largest number of vacant lots near transit and Figure 4 summarizes CTA Stations with the largest number of vacant lots within a half-mile proximity. The figures show that the largest numbers of City-owned and privately-owned vacant lots near transit are found in community areas such as Englewood, East Garfield Park, North Lawndale, Austin, and Grand Boulevard, all of which are on the South or West Sides, and the CTA stations with the largest number of nearby City-owned and privately-owned vacant land include stops found in these same communities. The stations surrounded by the largest number of vacant lots are near the end of the Englewood branch of the Green Line at Halsted/63rd and Ashland/63rd. There are also several West Side stations with abundant nearby vacant lots such as the California/Lake and Kedzie/Lake Green Line stations (featured in the Elevated Chicago case study) and the Kedzie-Homan and Pulaski-Congress stops of the Blue Line Forest Park Branch.
Figure 3. Top 10 City of Chicago Community Areas with the Largest Number of Vacant Lots within ½ Mile of a CTA Train Station, As of July 2023 and Tax Year 2021
Figure 4. Top 10 CTA Stations with the Largest Number of Vacant Lots within ½ Mile, As of July 2023 and Tax Year 2021
The interactive map below allows a user to explore the relationship between vacant land and transit at the neighborhood level. In addition to map features like proximity to a CTA station, the tooltip for each property also includes information on the vacant land type (i.e. privately-held or City-owned), the parcel address, and the zoning classification. For more information on zoning classifications as of 2019, click here. To view a full-size version of the interactive map, click here.
Figure 5. Privately-Held (Tax Year 2021) and City-Owned Vacant Land (As of July 2023) in the City of Chicago and CTA 1/2 Mile Station Buffers
Community Perspectives on Vacant Land Near Transit: An ETOD Deep Dive
As part of broader work on this issue, Elevated Chicago and local partners Garfield Park Community Council and Endeleo Institute facilitated community conversations to determine what neighborhood residents would like to do with the vacant land near transit in their communities, as well as the barriers to achieving those goals. Residents pointed to the opportunity for the redevelopment of these lots to provide necessities such as grocery stores, affordable housing, open spaces, and community services. However, they also noted that there must be better communication with city agencies about planned programs and opportunities to fully realize the communities’ visions. Additionally, community members pointed to significant administrative, financial, and programmatic requirements for acquiring land from the city, which often strain the capacities of community groups and small-scale developers. This last obstacle emphasizes the need not just for financial resources, but also technical assistance from experts to help with the many stages of the redevelopment process.
To learn more about community perspectives on vacant land near transit in East Garfield Park and Washington Heights/Roseland and potential ETOD solutions to this challenge, go the Chicago’s Vacant Lots Near Transit: An ETOD Deep Dive.
i The City-owned vacant lot data set used for this analysis was collected from the City-Owned Land Inventory on July 7th, 2023. The original data set was filtered to include only the vacant lot properties categorized as ‘Owned by City’ and without a listed managing organization. IHS revalidated the data by comparing these data from July 2023 to data accessed on November 28th, 2023. The November data included a new category for properties that received an application through the Chi Block Builder program. A comparison of the July and November data confirmed a consistent number and similar geographic pattern of City-owned vacant land in properties with Chi Block Builder applications.
To ensure continuity with technical assistance provided to Elevated throughout early 2023 on the topic, the privately-owned vacant lot data set was generated using a Tax Year 2021 parcel-level data set from the Cook County Assessor’s Office. The original data set was filtered to include properties under the Codes for Classification of Property - Tax Class 1-00 (Vacant Land). Given the wide range of potential redevelopment options for vacant land (from small-scale open space to commercial real estate), lots of all sizes are included in this analysis. However, IHS further explored the issue of lot size in order to ensure that the analysis did not over-emphasize either very small or very large lots. According to this analysis, nearly 60 percent of privately-held vacant lots near transit roughly conform to standard residential city lot sizes. Only eight percent of the data are lots with sizes that are likely too small to support real estate development but could potentially be re-purposed for other types of neighbor uses. Additional analysis of the characteristics of specific vacant lots is required to determine their appropriateness for a particular end use.
Both City-owned and privately-owned vacant lot data sets were geospatially processed to append an indicator of proximity to the nearest CTA train station to each property. A 0.5-mile buffer around each CTA train station was used to identify vacant lots near transit. The analysis only looked at CTA train stations and not proximity to Metra stations or high-capacity bus routes as previous TOD incentives in Chicago have largely focused on areas near CTA train stations.
An additional step of data processing aggregated the total number of vacant lots near transit to the Chicago Community Area (CCA) and Chicago Ward (2023) geographical levels as well by the predominant Race and Ethnic group composition using 2019 American Community Survey (ACS) data at the 2010 Census Tract level.