A recent IHS blog provided a preliminary analysis of the rental housing market implications of a COVID-19-related economic downturn. It showed that in many ways, the current crisis threatens to amplify existing rental housing affordability challenges in Chicago and widen gaps between higher- and lower-income households and among neighborhoods.
This brief follow-up blog takes a closer look at homeownership and provides an initial analysis of how a COVID-19-related economic downturn could impact homeowners in Cook County. As with our previous blog, this analysis identifies a set of households with at least one member in an occupation most vulnerable to layoffs during the early months of sheltering in place (1). While it is increasingly clear that the economic impact of COVID-19 is spreading beyond the group of occupations and industries initially impacted by sheltering-in-place rules, these workers were the first hit, are predominantly lower- and moderate-income, and remain highly vulnerable to a deep and lengthy recession.
The legacy of the foreclosure crisis still looms large in many communities across Cook County. A COVID-19 recession will likely not result in the same dramatic increases in foreclosure activity seen during the last recession for the simple reason that mortgage lending has been dramatically reduced over the last decade and underwriting standards have tightened significantly. This means that there are fewer mortgages to foreclose on and the mortgages that are out there are generally less risky.
Regardless, the depth and breadth of recent job losses mean substantial lost income for many homeowners and increasingly vulnerable housing situations that will only become more precarious the longer an economic downturn continues. The goal of this analysis is to help frame conversations on the scope and scale of policy responses needed to stabilize potentially vulnerable homeowners.
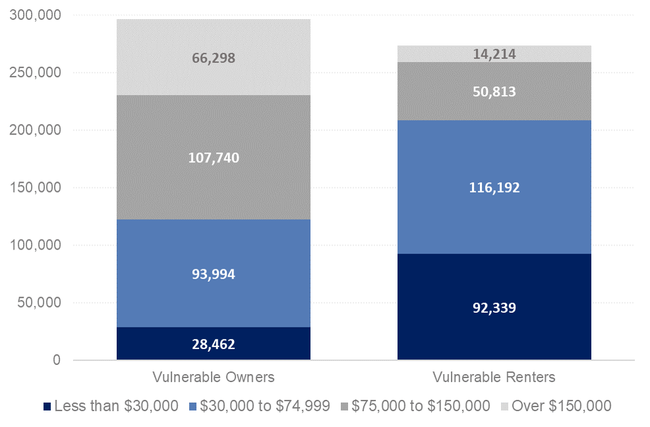
Across Cook County, there are roughly similar numbers of vulnerable owner and renter households, although owner households are more likely to earn higher incomes. The figure below shows that countywide there are 296,000 vulnerable owner households compared to 273,000 renters. However, vulnerable renters are predominantly lower-income. Roughly 34 percent of vulnerable renter households countywide earn less than $30,000 annually and over 76 percent earn less than $75,000. Conversely, nearly 60 percent of vulnerable owner households earn more than $75,000 annually and 22 percent earn more than $150,000 per year.
Figure 1. Number of Vulnerable Working Homeowner and Renter Households by Income, 2018
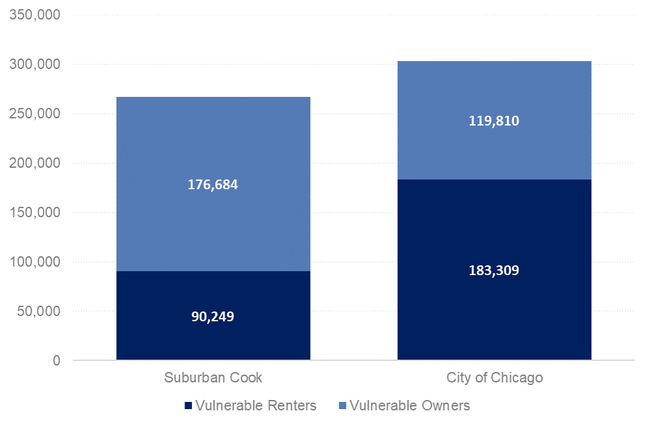
Because of overall higher levels of owner-occupancy in suburban Cook County, there are more workers in vulnerable occupations who are homeowners in the suburbs compared to the city. Across Cook County, there are nearly 300,000 owner-occupied households with a least one member in a highly vulnerable occupation. Nearly 60 percent of these vulnerable homeowners live in the suburbs, and over 66 percent of vulnerable households in suburban Cook County are homeowners. As described in our previous blog, roughly 60 percent of vulnerable households in the City of Chicago are renters.
Figure 2. Number of Vulnerable Working Homeowner and Renter Households in Suburban Cook County and City of Chicago, 2018
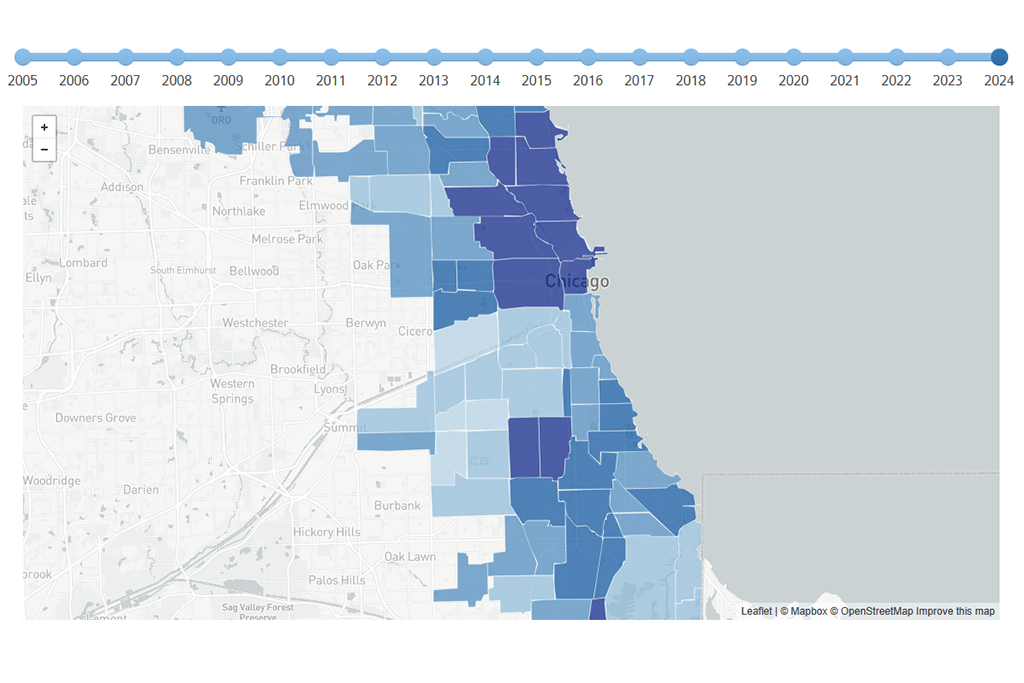
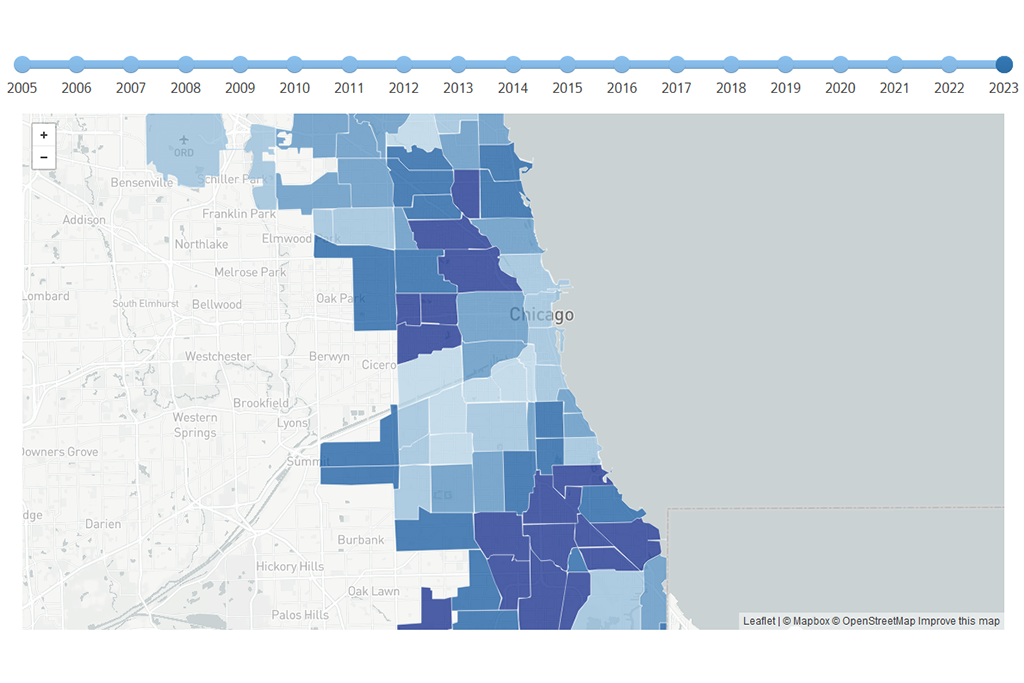
Geographically across Cook County, areas in south, southwest and near northern suburban Cook County have the largest number of vulnerable workers who are homeowners. All of these areas have at least 10,000 owner households with at least one vulnerable worker. In the City of Chicago, only the Gage Park/West Lawn on the city’s southwest side have that many vulnerable homeowners. For a statewide map of these patterns, click here.
Map 1. Number of Homeowner Households Working Occupations More Vulnerable to Job Layoffs, 2018
Homeowners’ housing costs are different than those of renters and can vary more substantially based on a number of factors. For renters, monthly rents are the primary housing cost. Rents typically do not go down and can increase as the demand for and cost of housing grows in a particular neighborhood. Renters also typically have lower incomes than owners and more frequently struggle with housing cost burdens.
Conversely, homeowners’ primary housing cost is their mortgage payment. For most mortgages, the monthly payment is fixed at the same level for the life of the loan. Particularly in the years since the foreclosure crisis, monthly mortgage payments are closely tied to a borrower’s income and ability to repay their mortgages. Because of the need to qualify for a mortgage, homeowners typically have higher incomes and some level of savings in place. Additionally, many long-term owners may no longer have mortgage debt to repay, and their primary costs are associated with property taxes, utilities, and maintenance.
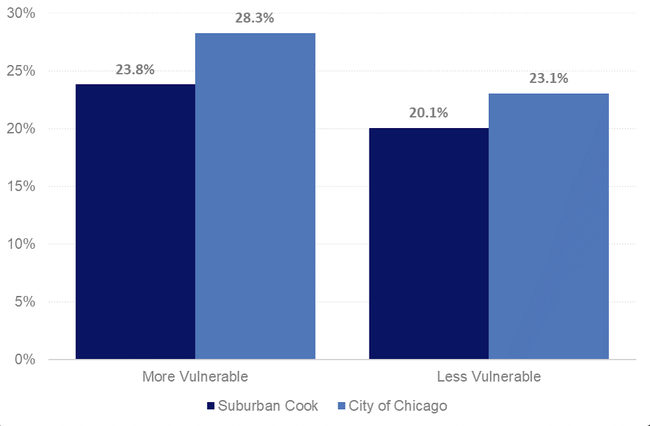
As with renters, vulnerable owner households were more likely to be cost-burdened than less vulnerable households. The figure below highlights levels of cost burden for vulnerable and less vulnerable homeowners in the City of Chicago and suburban Cook County. In the City of Chicago, over 28 percent of vulnerable owner households are already cost-burdened compared to roughly 23 percent for less vulnerable owner households. In suburban Cook, nearly 24 percent of vulnerable owner households are cost-burdened compared to 20 percent of less vulnerable owner households. Our previous blog highlighted that nearly 50 percent of vulnerable renter households in the City of Chicago were cost-burdened.
Pre-existing levels of cost burden are lower for owners than for renters for a number of reasons. As highlighted above, renters are more likely to be lower-income and therefore more likely to have entered the current crisis already struggling with housing costs. Second, many owners have paid off their mortgages and own their properties free and clear, therefore reducing their overall monthly housing costs. Countywide, over 30 percent of vulnerable owner households do not have mortgages, meaning they have lower housing costs and are less likely to be cost-burdened.
Figure 3. Share of Vulnerable and Less Vulnerable Owner Households that are Housing Cost Burdened in Suburban Cook County and City of Chicago, 2018
There are a number of areas in the City of Chicago and near north and south suburbs with high concentrations of these already burdened, vulnerable owner households. The figure below highlights levels of cost burden for vulnerable and less vulnerable homeowners in the City of Chicago and suburban Cook County. It should be noted that there are areas in Chicago and suburban Cook that either do not have a large number of overall homeowners or a large number of cost-burdened homeowners. This means these areas have less reliable data with higher margins of error. Submarkets with high margins of error are cross-hatched on the map below and results for these areas should be interpreted with caution. For a statewide map of these patterns, click here.
Map 2. Share of Vulnerable Homeowner Households that are Housing Cost Burdened, 2018
Foreclosure moratoria, mortgage forbearance programs, and enhanced unemployment benefits should mitigate some of the most immediate risks for many homeowners who have experienced job loss. However a longer economic downturn will likely require additional support for vulnerable homeowners.
IHS plans to continue to produce data and analysis on this issue in future blogs. To keep up-to-date on IHS analysis, sign up for our email list and follow us on Twitter, Facebook, or LinkedIn.