Every week there are new stories in the Chicago media highlighting new real estate investments, announcing new projects, discussing new or existing community assets, and describing the ways neighborhood residents are responding to housing market and demographic changes in their communities.
In 2019, IHS developed a tool that maps these stories alongside our Mapping Displacement Pressure typologies in order to contextualize these stories within their neighborhood market context. Recently, IHS updated this Mapping Stories of Neighborhood Change interactive tool to include our updated Mapping Displacement Pressure data and news stories that were published in 2021 and 2022.
These new stories describe the ways that COVID-19 continues to impact neighborhood businesses and housing affordability, efforts to create and preserve affordable housing, recent investments and development announcements in Chicago’s South and West Sides, and many other topics. On the map, you’ll find stories that:
- Profile a variety of developments that are transit-oriented, culturally driven, and equitable
- Describe efforts aimed at preserving and creating affordable housing as a means of neighborhood improvement and preservation, particularly in Chicago’s South and West Sides
- Cover key large- and small-scale projects that leverage vacant land, the arts, and community insight
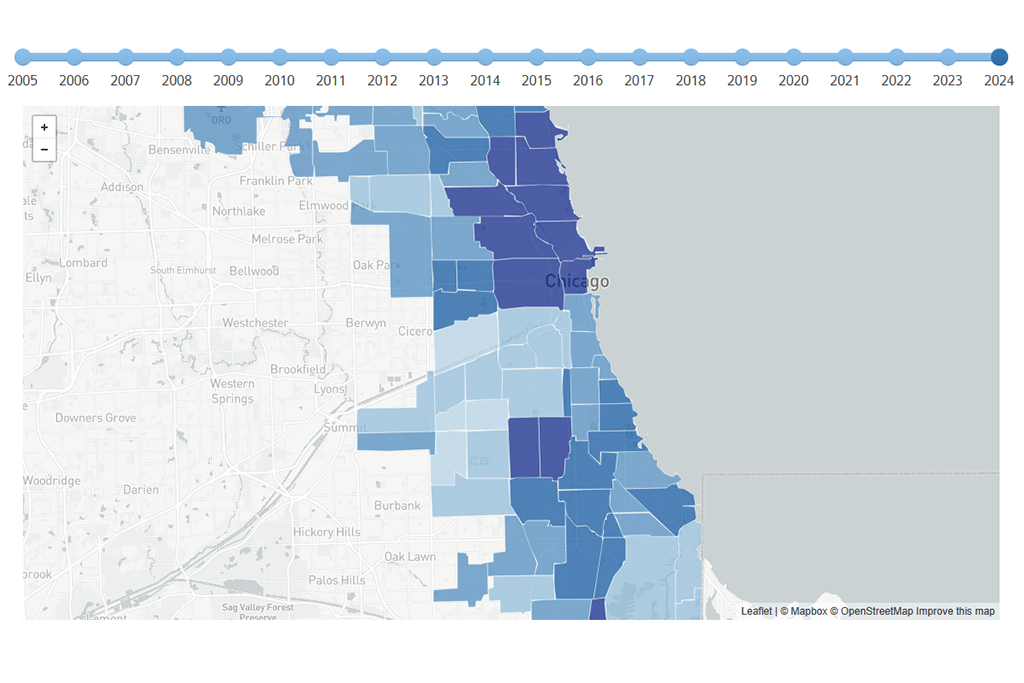
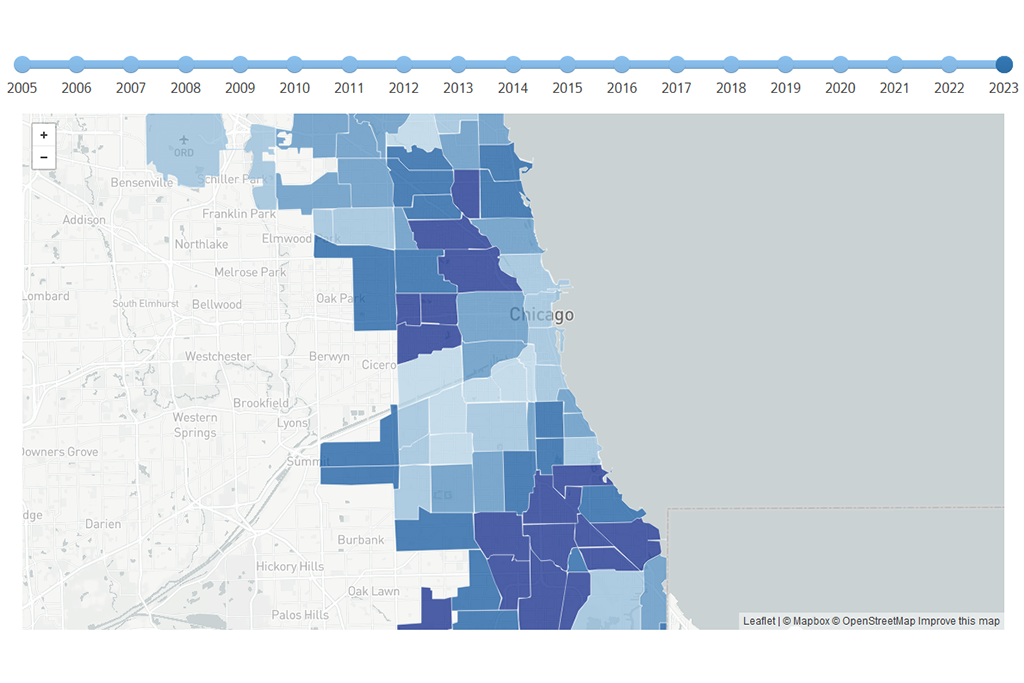
Explore the map tool below by clicking on each point to display the related media story and access the link to the original story. Users can click each census tract to display housing market typology information, including price tiers and changes. The mapping tool is updated regularly as new media stories appear. Click here for a full-page version of the map below.
About the Mapping Tool
The ways that neighborhoods change can vary based on numerous factors associated with a community’s demographic, economic, and housing market contexts. All communities have unique dynamics, histories, and subsequent challenges. In some areas, neighborhoods have experienced disinvestment, a deteriorating housing stock, and population decline. Communities are working to reverse these trends and attract new investment. Other areas have seen lost affordability from increasing rental demand and a rise in development activity. Community residents are struggling with displacement pressures, changes to long-term businesses, and the implications of a flood of outside investment.
Pairing real-time news stories with our data on affordability pressures and displacement risk can provide spatial, housing market, and demographic context that helps readers assess the potential implications of the activities described in each article. These stories also have the ability to provide on the ground narratives, local resident perspectives, and information on how changes transpire across city blocks.
Chicago is fortunate to have a rich media landscape and many outlets that invest in the coverage of neighborhood news. We want to thank all of these publications and journalists for their work, particularly Block Club Chicago whose reporting is extensively featured on the map. To read more about the Mapping Stories of Neighborhood Change tool, click here.